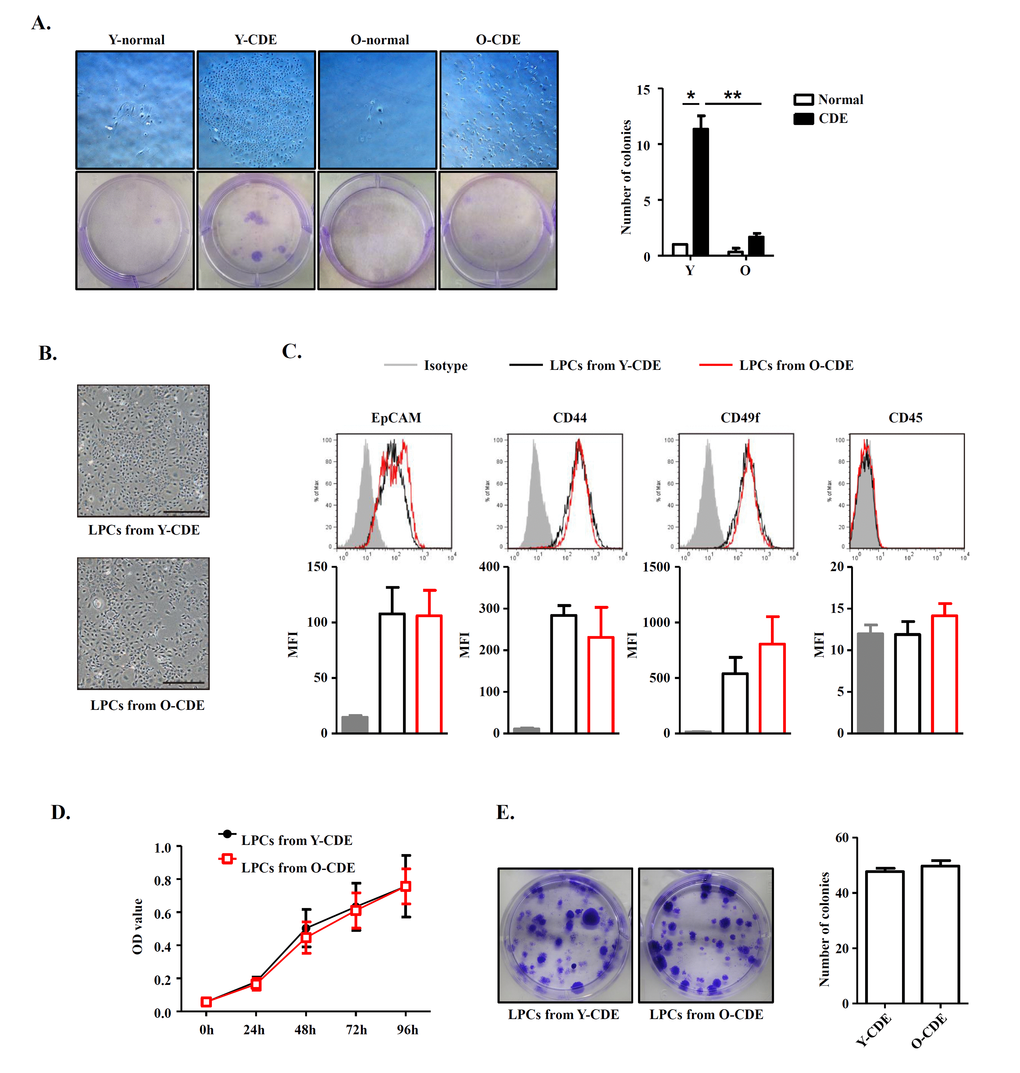
Figure 3.Comparison between LPCs isolated from Y/O mice. (A) Clonogenic colony-forming assay of freshly isolated EpCAM+CD45- cells from Y/O mice with normal/CDE diet. Pictured are wells of each condition. Scale bar = 500 μm. Colony number was quantified. Results are mean ± SEM from three independent experiments. (B) Morphology of cultured LPC lines from Y/O-CDE mice. Scale bar = 500 μm. (C) LPC lines from Y/O-CDE mice were analyzed for the indicated markers by FCM. Fluorescence intensities of markers were analyzed. MFI indicates mean fluorescence intensity. (D) Proliferation of LPC lines in vitro culture were analyzed by CCK-8 assay. Results are mean ± SEM from three independent experiments. (E) Clonogenic colony-forming assay of LPC lines from Y/O-CDE mice. Pictured are wells of each condition. Colony number was quantified. Results are mean ± SEM from three independent experiments. *P < 0.05, **P < 0.01.