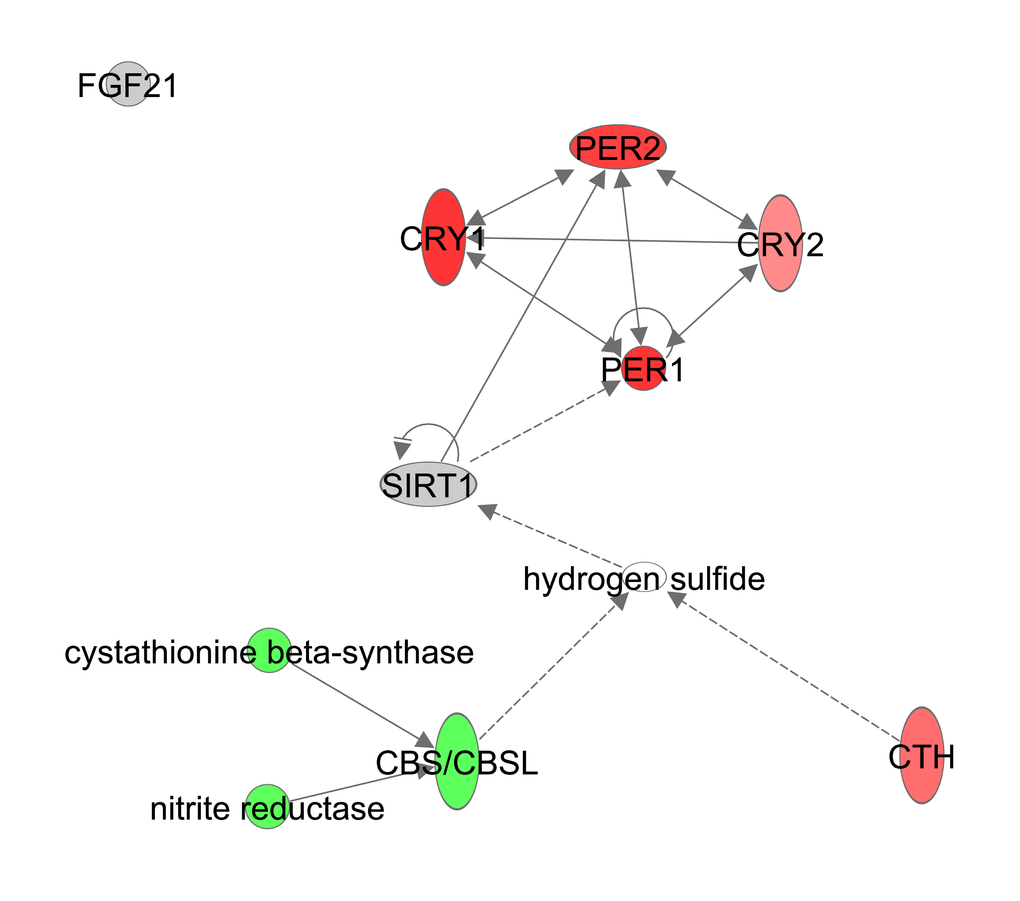
Figure 12.Hydrogen Sulfide production constructed in Ingenuity Pathway Analysis (IPA, www.qiagen.com/ingenuity) program. The normalized counts for each gene were correlated with the increase in calorie restriction (CR) level by Pearson correlation method. The pathway is colored based on a cut-off of an absolute correlation coefficient higher than 0.3. Red indicates a positive correlation with increasing CR level while green indicates a negative correlation.