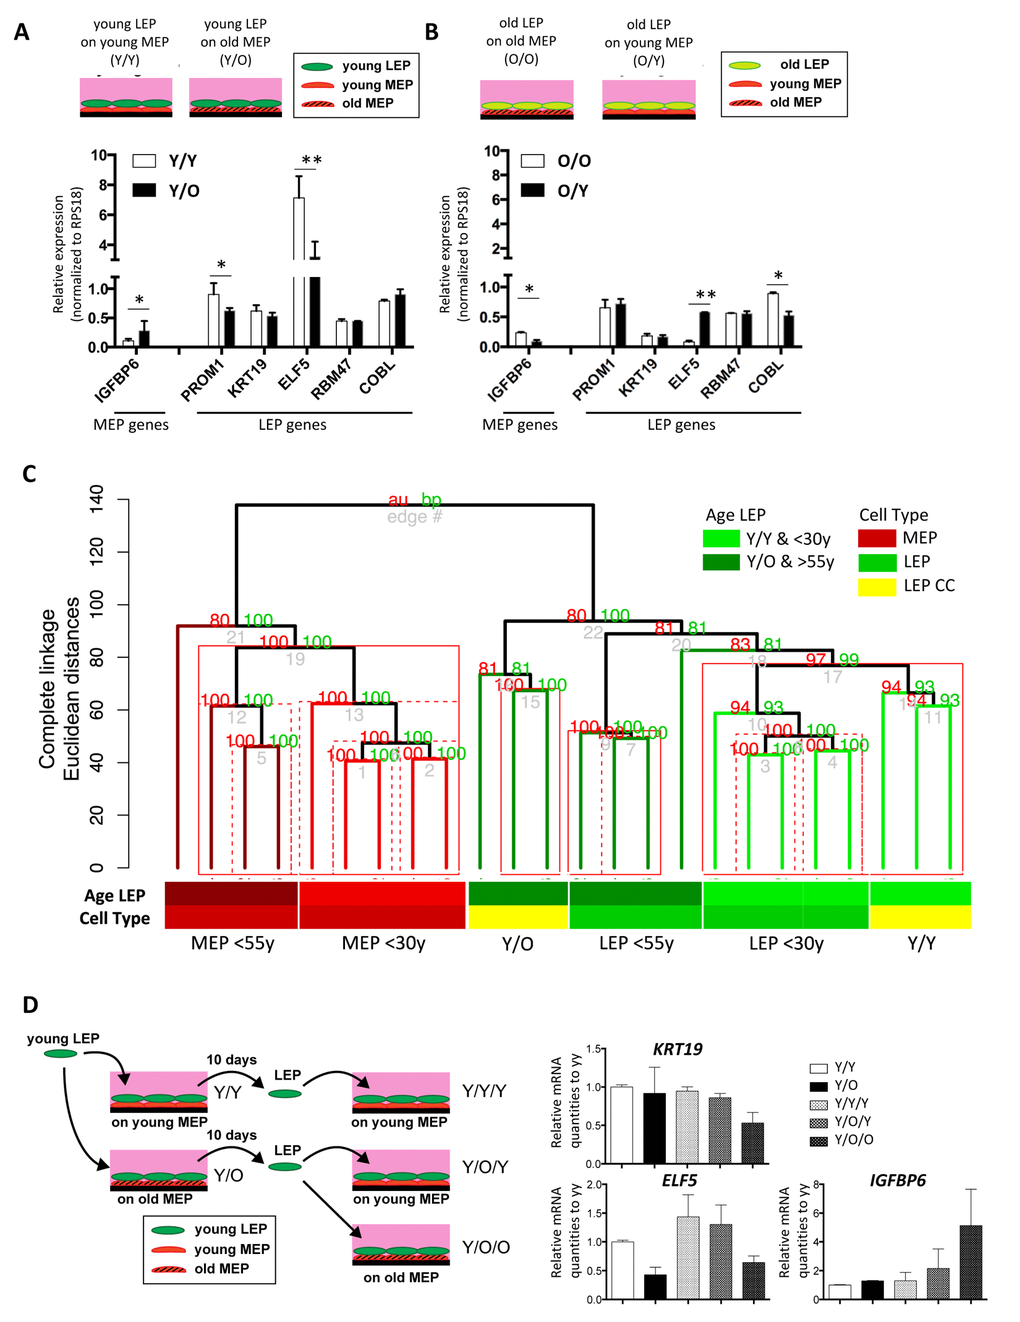
Figure 4.Chronological age of the apical microenvironment determines age-dependent gene expression patterns in luminal cells. (A) Schematic shows co-culture conditions VI and VII, with young LEP atop of young or old MEP, respectively. Bar graph shows differences in LEP-specific gene expression, and IGFBP6 a MEP-specific gene, in young LEP after 10 days culture on young (white) or old (black) MEP feeders. Mean ±SD, normalized to expression of RPS18. (B) Schematic shows co-culture conditions, with old LEP atop of old or young MEP, respectively. Bar graph shows differences in LEP-specific gene expression, and in IGFBP6 a MEP-specific gene, in old LEP after 10 days culture on young (white) or old (black) MEP feeders. Mean ±SD, normalized to expression of RPS18 (n=3). * and ** showed statistical significances at p<0.05 and p<0.01, respectively. (C) Unsupervised hierarchical clustering of <30y LEP in Y/Y (n=3) and Y/O (n=3) co-cultures in parallel with <30y (n=5) and >55y (n=4) 4p LEP and MEP isogenic to the MEP strains used in co-culture (Illumina HumanHT-12 v4 BeadChips Set2). Clustering was performed on transcriptome-wide log2 gene expression levels (n=26,599 gene probes, m=20,577 mapped genes) using Euclidean distance measures and complete linkage. Percent Approximately Unbiased (AU) p-values in red, and percent Bootstrap Probability (BP) in green are calculated and annotated above each cluster (pvclust R package). Clusters with AU > 95% are highlighted by red rectangles, solid red rectangles denotes largest cluster supported by data. (D) Schematic of experimental outline for extended co-cultures. LEP were separated by FACS after 10 days co-culture either with young MEP (Y/Y) or old MEP (Y/O). LEP from Y/Y and Y/O were further co-cultured with young MEP (Y/Y/Y and Y/O/Y) or older MEP (Y/O/O). (E) Bar graphs showing gene expression levels of KRT19, ELF5 and IGFBP6 in LEP following the 7-day culture experiments. Expression was normalized to expression of RPS18 and shown by relative expression to those of Y/Y.