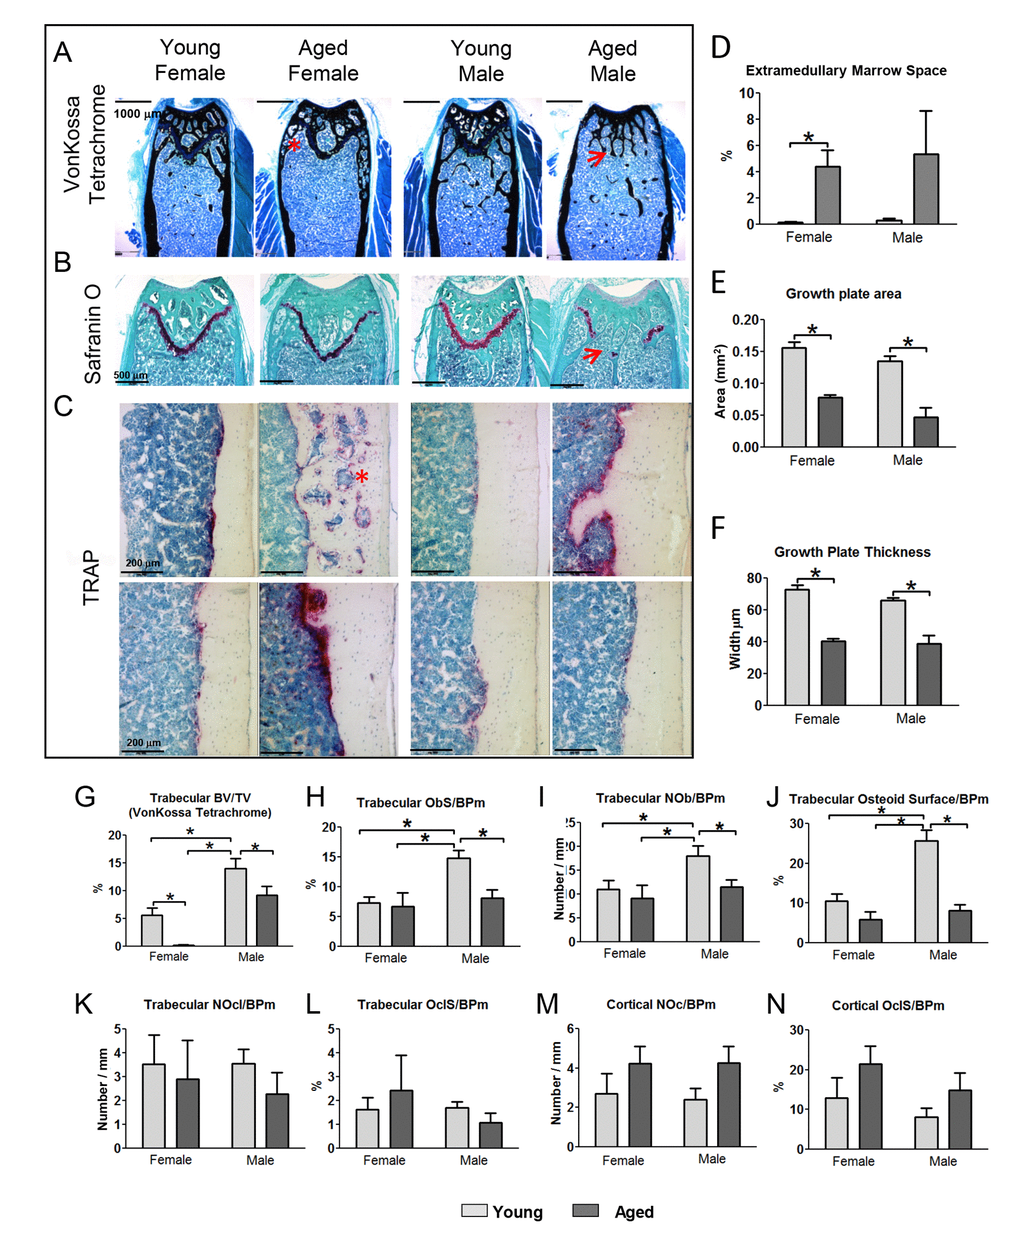
Figure 6.Histomorphometry shows increased extramedullary marrow, decreased osteoblast activity and decreased growth plate area and thickness in aged mice. (A) von Kossa Tetrachrome stained sections (Bar = 1000μm) and (B) Safranin O stained sections (bar = 500μm) from the distal femur in young and aged mice. (C) TRAP stained sections at the midshaft. The images on two rows show different individual mice to illustrate the variability of TRAP staining in aged mice (Bar = 200μm). Arrows indicate regions where the growth plate has closed and * indicates extramedullary marrow spaces. (D) Quantitation of the extramedullary marrow space area, (E) growth plate area and (F) growth plate thickness from von Kossa Tetrachrome stained sections in young and aged mice. (G-L) show histomorphometric quantitation of osteoblast and osteoclast parameters in femoral trabecular bone of young and aged mice. (M and N) show histomorphometric quantitation of osteoclast parameters in cortical bone of young and aged mice. (Data are mean ± SEM, * = p< 0.05, ANOVA/Tukey’s; females n=5, males n=6).