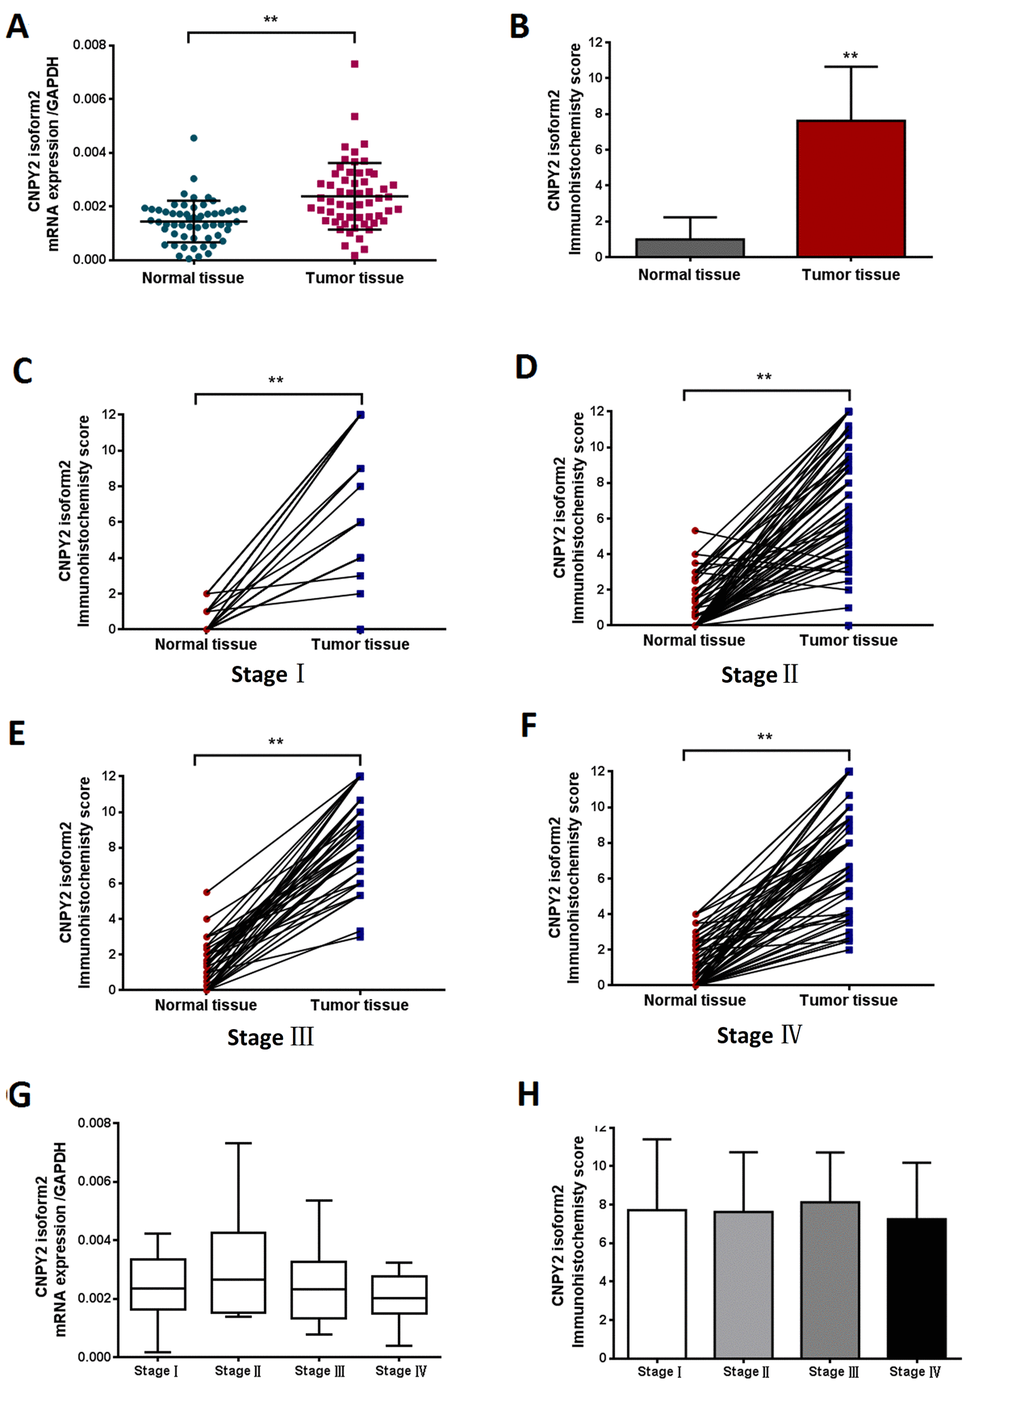
Figure 2.CNPY2 isoform2 expression in CRC tissues detected by RT-PCR and TMA-IHC. (A) Preferential expression of CNPY2 isoform2 mRNA was observed in CRC tissues compared matched tumor-adjacent normal tissues, (n = 57, **, P < 0.01). (B) Increased expression of CNPY2 isoform2 protein was detected in tumor tissues compared to matched tumor-adjacent normal tissues among all patients (n = 285, 7.6 ± 0.2 vs. 1.0 ± 0.1, **, P < 0.01). (C-F) Increased expression of CNPY2 isoform2 protein was detected in tumor tissues compared to matched tumor-adjacent normal tissues among patients with stage I-IV disease (C: Stage I,7.7 ± 0.6 vs. 0.5 ± 0.1; D: Stage II,7.4 ± 0.3 vs. 1.0 ± 0.2; E: Stage III,8.6 ± 0.3 vs. 1.3 ± 0.2; F: Stage IV,7.5 ± 0.4 vs. 1.0 ± 0.2; **, all P < 0.01). (G) Expression level of CNPY2 isoform2 mRNA was slightly higher in stage II CRC but did not reach statistical significance compared to that in other stages (n = 57, P > 0.05). (H) CNPY2 isoform2 protein expression was comparable among patients with disease stage I-IV (n =2 85, P > 0.05).