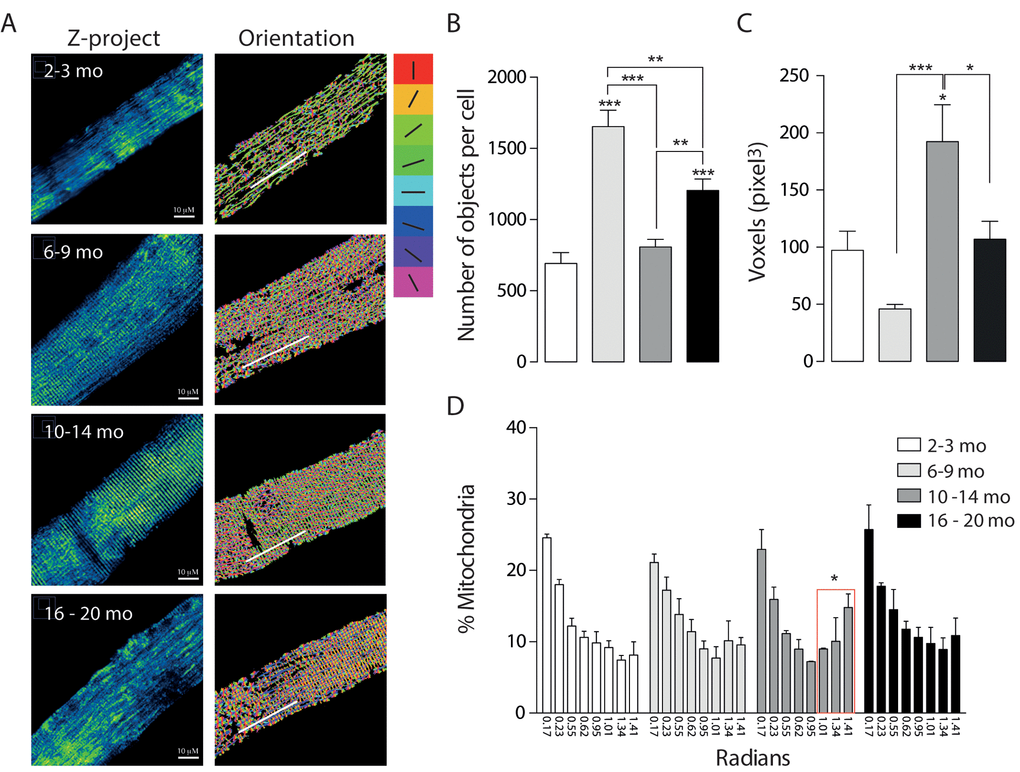
Figure 2.Mitochondrial morphology and orientation are different in the different age groups. Each bar represents the mean ± SD of 4-5 mice. *p<0.05. **p<0.01 ***p<0.001 (A) Representative Confocal images of isolated FDB muscle fibers electroporated with Mito-DsRed for each age group are shown in pseudo-color. Right panel shows the different orientations of mitochondria given in the analysis in different colors (B) Number of mitochondria per cell is significantly increased in the Young (6 - 9 mo) group. (C) Volume of mitochondria is significantly increased in the adult group when compared with young and old. (D) Histogram representing the orientation of mitochondria shows an important shift from longitudinal towards a transverse orientation in the middle age group.