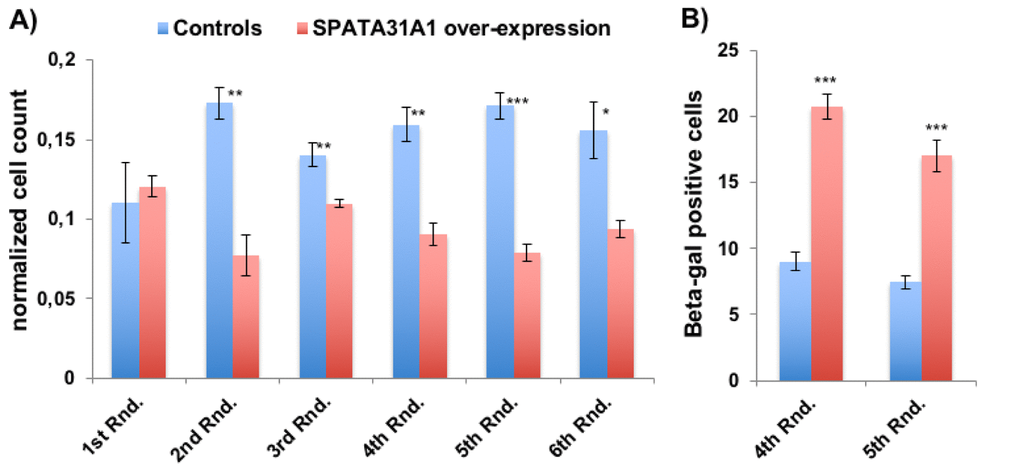
Figure 1.SPATA31A1 over-expression leads to reduced cell growth and increased senescence. (A) Relative number of cells per flask after each round of 3 weeks of culturing. The first round (1st Rnd) represents the normalized cell numbers three weeks after the initial seeding. Differences in normalized cell numbers became significant after the 2nd round, up to the 6th round when the experiment ended. The blue bars represent the averages and standard error of the four replicates of the control cells and the red bars the SPATA31A1 over-expressing cells. The numbers were normalized with respect to total cell counts. See Suppl. Figure S1 for the immunofluorescence images of control-eGFP and SPATA31A1-eGFP expression. (B) Senescence of SPATA31A1 over-expressing cells detected by the ß-galactosidase assay. The fraction of ß- galactosidase (+) staining cells from the 4th and 5th Rnd of re-culturing are shown with standard error between replicates. See suppl. Figure S2 for an example of staining results for senescence-associated ß-galactosidase assay. P-values indicated above the bars (*p< 0.05, **p< 0.01, ***p< 0.001; student t-test).
Figure 1 — Involvement of SPATA31 copy number variable genes in human lifespan | Aging