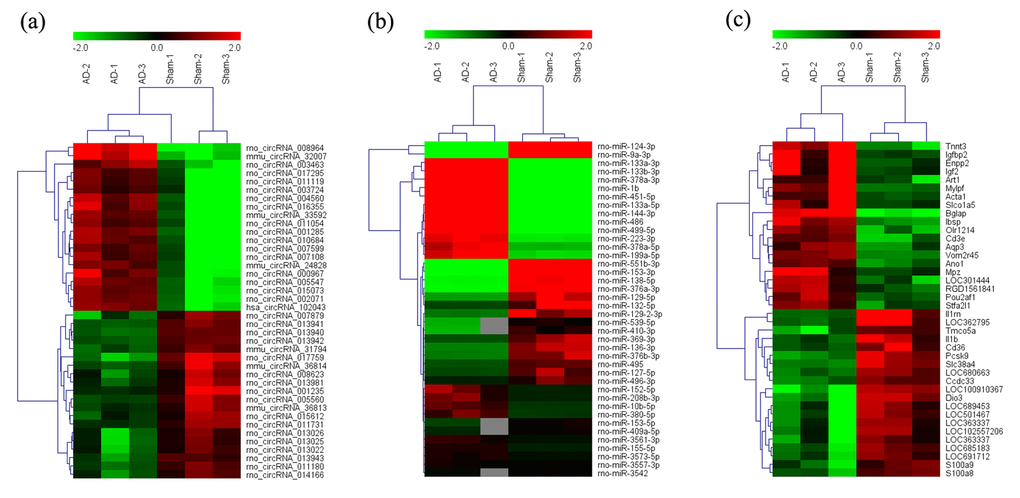
Figure 1.Heat map of the top 40 differentially-expressed circRNAs (A), miRNAs (B), and mRNAs (C) in AD hippocampal tissue. The data are depicted as matrices in which each row represents one circRNA, miRNA, or mRNA and each column represents one of the hippocampal samples. Relative circRNA, miRNA, or mRNA expression is depicted according to the color scale shown at the top. Red and green represent high and low relative expression, respectively; -2.0, 0, and 2.0 are fold-changes in the corresponding spectrum. The magnitude of deviation from the median is represented by color saturation.