


Introduction
Alzheimer’s disease (AD), the most common cause of dementia worldwide, is becoming more prevalent due to the aging population, and represents one of the grand challenges to health care systems [1]. Although substantial progress has been made in the identification of disease-related molecular and cellular processes over the last decade, the molecular mechanisms that underlie the pathogenesis of AD remain largely unknown [2], and none of the pharmacological treatments presently available for AD are able to stop or slow down the progression of this disease [3].Therefore, further investigation of the underlying disease mechanisms are urgently required in order to better understand AD and to facilitate the development of effective therapeutic strategies.
Currently, accumulating evidence indicates that noncoding RNAs (ncRNAs), especially microRNAs (miRNAs), long non-coding RNAs (lncRNAs), and circular RNAs (circRNAs), are strongly implicated in AD-associated pathophysiology, including amyloid-β plaques and neurofibrillary tangles, synaptic loss and neuronal death [4,5]. In a previous study, we investigated the hippocampal expression patterns of dysregulated lncRNAs in a rat model of AD using microarray analysis and demonstrated that lncRNAs contributed to the pathogenesis of AD [6]. To further investigate the regulatory role of ncRNAs in AD, we focused upon circRNAs, a class of ncRNAs that are highly expressed in the mammalian brain [7,8], and can regulate transcriptional and post-transcriptional gene expression [9]. Unlike linear RNA, circRNA is formed with covalently closed continuous loops without 5’-3’ polarity and a poly(A) tail, and might function as microRNA sponges to modulate the expression of parental genes through the competing endogenous RNA (ceRNA) network [10]. Recent studies have provided evidence that the circRNA-associated ceRNA network may play a crucial role in many disease processes, including AD [11]. For example, Lukiw et al. [12,13] demonstrated that circRNA-7(ciRS-7) acted as a natural miRNA sponge for miRNA-7 and regulated the expression of ubiquitin-conjugating enzyme E2A (UBE2A) and the epidermal growth factor receptor (EGFR) in sporadic AD hippocampal brain. Zhang et al. [14] characterized circRNA-associated-ceRNA networks in the cerebral cortex of senescence-accelerated mouse prone 8(SAMP8). Additionally, Zhong et al. [15] described the expression of circRNAs in different ages of SAMP8 mice. However, the potential role of circRNAs in the pathogenesis of AD is still in its infancy and has yet to be characterized, particularly the role of circRNA-associated-ceRNA networks in the hippocampus of AD.
In the present study, we used a microarray analysis approach to identify differentially-expressed profiles of circRNAs, miRNAs and mRNAs in the hippocampus of Aβ1-42-induced AD model rats, which is a useful experimental animal model of AD which emphasizes the inflammatory component of the disease pathology, and strongly complements the use of transgenic animal models in advancing our understanding of AD [16]. Next we performed Gene ontology (GO) and Kyoto Encyclopedia of Genes and Genomes (KEGG) analyses. We also constructed a circRNA-associated-ceRNA network. Findings arising from this study will expand our understanding of the potential role of the circRNA-associated-ceRNA network involved in AD pathogenesis and therapeutic strategy.
Results
Altered circRNA, miRNA and mRNA profiles in the AD rat hippocampus
The expression of circRNAs, miRNAs, and mRNAs in the hippocampus of AD rats were profiled using microarrays. Using a threshold of fold change (FC) ≥ 2.0 and a p-value < 0.05, 555 circRNAs, 183 miRNAs, and 319 mRNAs were significantly altered in the AD rat hippocampus compared to sham controls. The results showed that 444 circRNAs, 93 miRNAs, and 173 mRNAs were up-regulated, while 111 circRNAs, 90 miRNAs, and 146 mRNAs were down-regulated. The most up-regulated were circRNA_008964, miR-133a-5p, and BGLAP with FCs of 16.97, 355.67, and 22.96, respectively, whereas circRNA_017759, miR-551b-3p, and IL-1RN were the most down-regulated, with corresponding FCs of 6.32, 257.63 and 14.21. The top 20 up-regulated and 20 down-regulated circRNAs, miRNAs, and mRNAs in the AD group are listed in Tables 1-3. Hierarchical clustering and volcano plot visualization (Fig. 1 and 2) suggested that the expression level of circRNAs, miRNAs and mRNAs were distinguishable and variable.
Table 1. Top 40 differently expressed circRNAs in microarray analysis.
| circRNA | p-value | FDR | Fold change | Regulation | chrom | strand | circRNA_type | Gene symbol |
| rno_circRNA_008964 | 0.000606 | 0.094365 | 16.9714 | up | chr2 | + | exonic | Ppp3ca |
| mmu_circRNA_32007 | 0.002111 | 0.108069 | 16.57521 | up | chr18 | - | sense overlapping | RGD1308601 |
| rno_circRNA_004560 | 0.018609 | 0.182842 | 10.47134 | up | chr14 | - | exonic | RGD1305110 |
| rno_circRNA_017295 | 0.037675 | 0.225271 | 10.14399 | up | chr9 | - | exonic | Clk1 |
| rno_circRNA_016355 | 0.029281 | 0.207134 | 10.00513 | up | chr8 | - | sense overlapping | Birc2 |
| rno_circRNA_001285 | 0.01166 | 0.16506 | 9.170892 | up | chr1 | + | exonic | Pdcd11 |
| rno_circRNA_011119 | 0.043819 | 0.236427 | 8.989032 | up | chr3 | - | exonic | Ext2 |
| mmu_circRNA_33592 | 0.023237 | 0.196417 | 8.459 | up | chr3 | - | exonic | Acvr1 |
| rno_circRNA_003724 | 0.044537 | 0.237503 | 7.782604 | up | chr12 | - | exonic | RGD1309762 |
| rno_circRNA_010684 | 0.016463 | 0.17835 | 7.75411 | up | chr3 | - | exonic | Golga1 |
| rno_circRNA_011054 | 0.034331 | 0.216266 | 7.619158 | up | chr3 | + | intergenic | |
| rno_circRNA_007599 | 0.023829 | 0.197354 | 7.284635 | up | chr18 | + | sense overlapping | Zfp516 |
| rno_circRNA_007108 | 0.028113 | 0.205101 | 7.274158 | up | chr18 | + | exonic | Wdr33 |
| mmu_circRNA_24828 | 0.019181 | 0.184686 | 7.260869 | up | chr6 | + | sense overlapping | Tssc1 |
| rno_circRNA_005547 | 0.015465 | 0.175514 | 7.112599 | up | chr15 | + | exonic | Mipep |
| rno_circRNA_000967 | 0.014718 | 0.173347 | 7.044118 | up | chr1 | + | exonic | Cpsf7 |
| rno_circRNA_015073 | 0.017918 | 0.182842 | 7.039097 | up | chr7 | - | exonic | Polr3b |
| rno_circRNA_003463 | 0.013453 | 0.170196 | 6.770216 | up | chr12 | + | exonic | Slc46a3 |
| rno_circRNA_002071 | 0.008468 | 0.149026 | 6.626886 | up | chr10 | + | exonic | Tekt5 |
| hsa_circRNA_102043 | 0.00576 | 0.138131 | 6.473515 | up | chr10 | + | exonic | Acaca |
| rno_circRNA_017759 | 0.002899 | 0.111828 | 6.320172 | down | chrX | + | intergenic | |
| mmu_circRNA_36814 | 0.01092 | 0.161814 | 3.519062 | down | chr5 | + | exonic | Rad23b |
| rno_circRNA_007879 | 0.017054 | 0.179628 | 3.370089 | down | chr19 | - | exonic | Nr3c2 |
| rno_circRNA_001235 | 0.042661 | 0.234935 | 3.322749 | down | chr1 | - | exonic | Got1 |
| rno_circRNA_005560 | 0.00972 | 0.154309 | 2.990798 | down | chr15 | + | exonic | Dpysl2 |
| rno_circRNA_013940 | 0.00004 | 0.066585 | 2.94782 | down | chr6 | + | exonic | Ptprn2 |
| rno_circRNA_013941 | 0.000249 | 0.077601 | 2.893453 | down | chr6 | + | exonic | Ptprn2 |
| rno_circRNA_008623 | 0.042057 | 0.233777 | 2.8228 | down | chr2 | + | sense overlapping | Ash1l |
| rno_circRNA_013981 | 0.029554 | 0.207381 | 2.812952 | down | chr6 | - | exonic | Nrxn1 |
| rno_circRNA_013026 | 0.044491 | 0.23747 | 2.785261 | down | chr5 | + | exonic | Rere |
| rno_circRNA_013942 | 0.000182 | 0.077601 | 2.733282 | down | chr6 | + | exonic | Ptprn2 |
| rno_circRNA_013025 | 0.041907 | 0.233777 | 2.704128 | down | chr5 | + | sense overlapping | Rere |
| mmu_circRNA_31794 | 0.001829 | 0.105466 | 2.669903 | down | chr18 | + | exonic | Camk2a |
| rno_circRNA_015612 | 0.029545 | 0.207381 | 2.653884 | down | chr7 | - | exonic | Trps1 |
| mmu_circRNA_36813 | 0.026985 | 0.203613 | 2.590337 | down | chr5 | + | exonic | Rad23b |
| rno_circRNA_013022 | 0.041158 | 0.23268 | 2.585987 | down | chr5 | + | exonic | Rere |
| rno_circRNA_013943 | 0.008876 | 0.15 | 2.525526 | down | chr6 | + | exonic | Ptprn2 |
| rno_circRNA_011180 | 0.003519 | 0.119602 | 2.509546 | down | chr4 | - | exonic | Magi2 |
| rno_circRNA_011731 | 0.012178 | 0.167316 | 2.50498 | down | chr4 | - | exonic | Grin2b |
| rno_circRNA_014166 | 0.017049 | 0.179628 | 2.501832 | down | chr6 | + | exonic | Dtnb |
Table 2. Top 40 differently expressed miRNAs in microarray analysis.
| Name | FC | P-value | FDR | Regulation | Sham -1 | Sham -2 | Sham-3 | AD-1 | AD-2 | AD-3 |
| rno-miR-133a-5p | 355.6778 | 1.49E-06 | 0.000597 | up | 0.030016 | 0.024263 | 0.025 | 9.676819 | 9.532174 | 8.988871 |
| rno-miR-133a-3p | 180.9255 | 0.000918 | 0.023498 | up | 0.139021 | 0.29636 | 0.278125 | 52.46193 | 40.3513 | 36.27822 |
| rno-miR-1b | 121.9097 | 0.017959 | 0.081167 | up | 0.35545 | 0.110919 | 0.207813 | 37.47377 | 30.81565 | 13.89984 |
| rno-miR-133b-3p | 112.2112 | 0.000352 | 0.016336 | up | 0.255924 | 0.589255 | 0.5125 | 59.63959 | 45.44174 | 47.2655 |
| rno-miR-152-5p | 77.69073 | 0.031524 | 0.108617 | up | 0.006319 | 0.010399 | 0.025 | 1.654822 | 1.069565 | 0.516693 |
| rno-miR-378a-5p | 57.07956 | 0.00038 | 0.01635 | up | 0.053712 | 0.084922 | 0.040625 | 2.900169 | 3.384348 | 3.947536 |
| rno-miR-208b-3p | 50.91059 | 0.017594 | 0.080291 | up | 0.020537 | 0.025997 | 0.014063 | 1.159052 | 1.396522 | 0.529412 |
| rno-miR-144-3p | 45.24951 | 5.72E-08 | 6.88E-05 | up | 0.104265 | 0.220104 | 0.2125 | 8.164129 | 8.168696 | 7.960254 |
| rno-miR-486 | 37.36758 | 0.000367 | 0.016336 | up | 0.1406 | 0.216638 | 0.253125 | 7.678511 | 8.709565 | 6.419714 |
| rno-miR-499-5p | 33.39683 | 0.003852 | 0.038921 | up | 0.349131 | 0.221837 | 0.19375 | 9.771574 | 9.996522 | 5.771065 |
| rno-miR-10b-5p | 33.32301 | 0.000977 | 0.023498 | up | 0.031596 | 0.025997 | 0.035938 | 1.219966 | 1.074783 | 0.82194 |
| rno-miR-155-5p | 33.28875 | 2.36E-07 | 0.000189 | up | 0.017378 | 0.015598 | 0.010938 | 0.49577 | 0.474783 | 0.491256 |
| rno-miR-3561-3p | 30.31098 | 0.009789 | 0.060993 | up | 0.022117 | 0.008666 | 0.014063 | 0.566836 | 0.526957 | 0.265501 |
| rno-miR-3573-5p | 27.40815 | 0.003971 | 0.039624 | up | 0.020537 | 0.003466 | 0.010938 | 0.358714 | 0.217391 | 0.381558 |
| rno-miR-378a-3p | 23.9381 | 0.011289 | 0.064185 | up | 0.93207 | 2.391681 | 1.076563 | 27.22673 | 27.89217 | 50.21622 |
| rno-miR-223-3p | 18.23247 | 0.013543 | 0.071138 | up | 0.265403 | 0.253033 | 0.314063 | 3.908629 | 7.328696 | 3.941176 |
| rno-miR-3557-3p | 16.94205 | 0.049043 | 0.137085 | up | 0.014218 | 0.003466 | 0.00625 | 0.218274 | 0.125217 | 0.062003 |
| rno-miR-199a-5p | 16.61341 | 8.89E-06 | 0.002256 | up | 0.306477 | 0.176776 | 0.207813 | 3.588832 | 3.928696 | 3.963434 |
| rno-miR-451-5p | 15.92029 | 0.00089 | 0.023498 | up | 1.391785 | 2.157712 | 1.814063 | 33.7868 | 28.18609 | 23.41653 |
| rno-miR-380-5p | 15.60035 | 0.004015 | 0.039631 | up | 0.047393 | 0.069324 | 0.101563 | 0.891709 | 1.481739 | 1.031797 |
| rno-miR-551b-3p | 0.003881 | 0.001551 | 0.027567 | down | 5.919431 | 8.823224 | 9.196875 | 0.033841 | 0.04 | 0.019078 |
| rno-miR-153-3p | 0.004766 | 4.37E-08 | 6.88E-05 | down | 7.663507 | 7.908146 | 7.759375 | 0.025381 | 0.036522 | 0.049285 |
| rno-miR-539-5p | 0.005103 | 0.000688 | 0.020933 | down | 1.507109 | 1.649913 | 1.375 | 0.00846 | 0.006957 | N/A |
| rno-miR-376a-3p | 0.005457 | 0.000188 | 0.012127 | down | 3.92891 | 5.07279 | 4.80625 | 0.018613 | 0.031304 | 0.025437 |
| rno-miR-124-3p | 0.007493 | 2.61E-05 | 0.003452 | down | 92.09321 | 80.76256 | 80.40625 | 0.592217 | 0.558261 | 0.747218 |
| rno-miR-136-3p | 0.007982 | 0.000226 | 0.013604 | down | 2.020537 | 2.564991 | 2.603125 | 0.025381 | 0.02087 | 0.011129 |
| rno-miR-129-5p | 0.008243 | 0.041911 | 0.124593 | down | 2.519747 | 6.67591 | 2.790625 | 0.047377 | 0.043478 | 0.007949 |
| rno-miR-9a-3p | 0.009872 | 0.000354 | 0.016336 | down | 41.50079 | 56.26516 | 48.03438 | 0.448393 | 0.542609 | 0.448331 |
| rno-miR-410-3p | 0.010002 | 0.002631 | 0.032583 | down | 1.919431 | 1.443674 | 1.782813 | 0.01692 | 0.017391 | N/A |
| rno-miR-153-5p | 0.011705 | 0.003247 | 0.035819 | down | 0.507109 | 0.582322 | 0.6875 | 0.001692 | 0.012174 | N/A |
| rno-miR-409a-5p | 0.012151 | 0.00348 | 0.036711 | down | 0.36019 | 0.298094 | 0.409375 | 0.001692 | 0.006957 | N/A |
| rno-miR-138-5p | 0.015186 | 0.014003 | 0.072249 | down | 8.292259 | 3.935875 | 4.757813 | 0.081218 | 0.095652 | 0.081081 |
| rno-miR-369-3p | 0.015371 | 0.004061 | 0.039771 | down | 1.259084 | 1.856153 | 2.292188 | 0.025381 | 0.024348 | 0.033386 |
| rno-miR-495 | 0.015832 | 9.38E-06 | 0.002256 | down | 1.265403 | 1.377816 | 1.423438 | 0.023689 | 0.029565 | 0.011129 |
| rno-miR-129-2-3p | 0.020383 | 0.005048 | 0.043957 | down | 3.361769 | 1.859619 | 2.346875 | 0.052453 | 0.074783 | 0.027027 |
| rno-miR-376b-3p | 0.023408 | 0.001105 | 0.025237 | down | 1.962085 | 1.953206 | 2.729688 | 0.079526 | 0.052174 | 0.023847 |
| rno-miR-127-5p | 0.028105 | 0.00953 | 0.06067 | down | 1.232227 | 2.107452 | 1.13125 | 0.060914 | 0.050435 | 0.014308 |
| rno-miR-132-5p | 0.02883 | 0.035542 | 0.115982 | down | 1.14218 | 4.088388 | 3.13125 | 0.089679 | 0.078261 | 0.073132 |
| rno-miR-496-3p | 0.029383 | 0.019014 | 0.082393 | down | 0.50237 | 1.315425 | 0.948438 | 0.025381 | 0.04 | 0.015898 |
| rno-miR-3542 | 0.029791 | 0.029799 | 0.10517 | down | 0.075829 | 0.152513 | 0.117188 | 0.003384 | 0.003478 | N/A |
Table 3. Top 40 differently expressed mRNAs in microarray analysis.
| Genbank Accession | Gene Symbol | P-value | FDR | Fold Change | Regulation | AD-1 | AD-2 | AD-3 | Sham -1 | Sham -2 | Sham -3 |
| NM_013414 | Bglap | 0.00055 | 0.026406 | 22.96703 | up | 8.052033 | 9.051468 | 8.575123 | 4.18026 | 4.55122 | 3.382667 |
| NM_001270665 | Tnnt3 | 0.028149 | 0.128763 | 12.35968 | up | 5.806189 | 5.275991 | 8.642943 | 3.211319 | 3.209004 | 2.422092 |
| NM_012587 | Ibsp | 0.001096 | 0.031424 | 5.771831 | up | 6.252816 | 5.279157 | 5.647549 | 3.384729 | 3.16391 | 3.043795 |
| NM_013122 | Igfbp2 | 0.038993 | 0.15308 | 5.754793 | up | 11.06608 | 9.303097 | 12.16206 | 8.300828 | 8.427517 | 8.228595 |
| NM_012605 | Mylpf | 0.026781 | 0.125297 | 5.641142 | up | 7.466302 | 7.129157 | 9.462192 | 5.464603 | 5.479666 | 5.625421 |
| NM_057104 | Enpp2 | 0.038489 | 0.15198 | 5.07149 | up | 12.46112 | 10.68197 | 13.24472 | 9.646646 | 9.645828 | 10.0681 |
| NM_001000438 | Olr1214 | 0.002217 | 0.039344 | 4.895564 | up | 5.185619 | 4.642926 | 5.070082 | 2.360833 | 3.241277 | 2.422092 |
| NM_031511 | Igf2 | 0.049039 | 0.175423 | 4.757985 | up | 13.65679 | 11.66636 | 14.31541 | 10.78843 | 10.91098 | 11.1881 |
| XR_086340 | LOC301444 | 0.014615 | 0.090422 | 4.340022 | up | 10.78893 | 10.89127 | 9.746195 | 8.448961 | 8.932608 | 7.691718 |
| XM_001059752 | Vom2r45 | 3.47E-05 | 0.016 | 4.296108 | up | 4.366794 | 4.380062 | 4.672477 | 2.360833 | 2.327317 | 2.422092 |
| NM_001108140 | Cd3e | 0.003543 | 0.047336 | 4.22607 | up | 4.738903 | 4.657002 | 4.962316 | 2.360833 | 2.402169 | 3.357269 |
| NM_001107541 | Art1 | 0.043071 | 0.162562 | 3.875367 | up | 4.757209 | 4.724255 | 6.257683 | 3.799408 | 3.654648 | 2.422092 |
| NM_031703 | Aqp3 | 0.008524 | 0.068504 | 3.685033 | up | 3.96804 | 4.769804 | 4.846925 | 2.360833 | 2.390517 | 3.188386 |
| BC078859 | Mpz | 0.028946 | 0.130331 | 3.67334 | up | 7.999598 | 7.897556 | 6.286076 | 5.421919 | 5.426666 | 5.703367 |
| NM_019212 | Acta1 | 0.047568 | 0.17213 | 3.632821 | up | 6.637662 | 6.667013 | 8.622218 | 5.496824 | 5.344661 | 5.502137 |
| NM_030838 | Slco1a5 | 0.031783 | 0.137186 | 3.400608 | up | 8.433027 | 7.296741 | 9.147305 | 6.444243 | 6.437362 | 6.69809 |
| NM_001107564 | Ano1 | 0.001239 | 0.03245 | 3.397198 | up | 8.816945 | 9.067116 | 8.695915 | 6.800028 | 7.044566 | 7.442346 |
| XM_227107 | RGD1561841 | 0.014316 | 0.089396 | 3.391897 | up | 10.07803 | 10.32065 | 9.068267 | 8.393194 | 8.027146 | 7.760331 |
| NM_001109599 | Pou2af1 | 0.008157 | 0.067119 | 3.171449 | up | 3.934713 | 4.788568 | 3.704984 | 2.360833 | 2.649913 | 2.422092 |
| NM_001004129 | Stfa2l1 | 0.011619 | 0.07994 | 3.137655 | up | 7.900152 | 8.128724 | 7.293016 | 5.570128 | 6.459183 | 6.343522 |
| NM_022194 | Il1rn | 0.036753 | 0.148451 | 14.21197 | down | 5.016814 | 4.992311 | 5.159386 | 9.625172 | 10.56531 | 6.465138 |
| XR_361775 | LOC100910367 | 0.004583 | 0.052819 | 10.16713 | down | 3.468741 | 4.307965 | 2.321873 | 6.875965 | 6.716166 | 6.54397 |
| BC098733 | LOC362795 | 0.032448 | 0.138888 | 9.708935 | down | 6.844371 | 6.675695 | 7.021456 | 10.91333 | 11.35412 | 8.112008 |
| NM_017210 | Dio3 | 0.002669 | 0.042782 | 6.519498 | down | 6.231844 | 6.621063 | 5.503228 | 9.068267 | 9.062721 | 8.339429 |
| XM_006255043 | LOC689453 | 0.049874 | 0.177224 | 5.455306 | down | 5.015599 | 5.841514 | 3.128502 | 7.675495 | 7.21799 | 6.435111 |
| XM_006227100 | LOC501467 | 0.030232 | 0.133751 | 5.431563 | down | 5.4069 | 6.083151 | 3.794581 | 8.035631 | 7.5748 | 6.998302 |
| NM_199253 | Pcsk9 | 0.002133 | 0.039056 | 5.204765 | down | 2.426524 | 2.665853 | 2.946293 | 5.604621 | 5.012788 | 4.56076 |
| NM_130748 | Slc38a4 | 0.000938 | 0.030292 | 4.934402 | down | 4.587482 | 4.637961 | 4.475671 | 7.354593 | 6.783875 | 6.471272 |
| NM_031512 | Il1b | 0.034329 | 0.143302 | 4.617557 | down | 4.037401 | 4.364745 | 3.874776 | 7.502599 | 6.263231 | 5.132481 |
| NM_001014221 | LOC363337 | 0.039423 | 0.154047 | 4.587823 | down | 8.473712 | 9.35102 | 7.109605 | 10.83744 | 10.83451 | 9.855817 |
| XR_349427 | LOC102557206 | 0.043126 | 0.162711 | 4.261659 | down | 7.166277 | 7.946725 | 5.904576 | 9.512047 | 9.477423 | 8.302353 |
| XM_006224554 | Tmco5a | 0.014583 | 0.090373 | 4.222635 | down | 5.590317 | 4.665117 | 6.381915 | 7.747607 | 7.674106 | 7.450068 |
| XM_006255374 | LOC685183 | 0.011431 | 0.079358 | 3.885825 | down | 4.719262 | 5.091599 | 3.778711 | 6.874688 | 6.423315 | 6.166232 |
| NM_001014221 | LOC363337 | 0.042926 | 0.162322 | 3.775706 | down | 9.380106 | 10.53603 | 8.459474 | 11.81476 | 11.39776 | 10.91333 |
| NM_001127377 | LOC680663 | 0.001338 | 0.033124 | 3.748348 | down | 3.41188 | 3.828432 | 3.532797 | 5.766442 | 5.629198 | 5.096233 |
| NM_031561 | Cd36 | 0.021348 | 0.110965 | 3.577859 | down | 4.227085 | 4.462658 | 4.176351 | 5.902704 | 7.071649 | 5.40903 |
| XM_006222689 | LOC691712 | 0.017104 | 0.098359 | 3.482986 | down | 4.723632 | 5.200954 | 3.846046 | 6.733775 | 6.481439 | 5.956392 |
| NM_053587 | S100a9 | 0.02089 | 0.109858 | 3.409311 | down | 5.465103 | 4.943009 | 3.967565 | 6.199166 | 6.637269 | 6.847683 |
| NM_001014091 | Ccdc33 | 0.000936 | 0.030292 | 3.293413 | down | 2.477567 | 2.602366 | 2.926151 | 4.675579 | 4.253647 | 4.235609 |
| NM_053822 | S100a8 | 0.006707 | 0.062417 | 3.266306 | down | 5.768222 | 5.836943 | 4.862041 | 7.00802 | 7.213229 | 7.368936 |
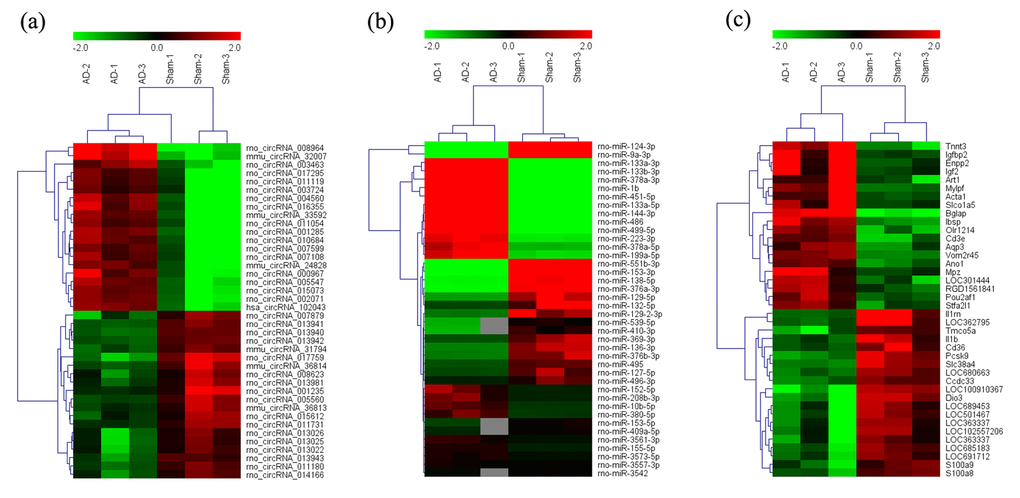
Figure 1. Heat map of the top 40 differentially-expressed circRNAs (A), miRNAs (B), and mRNAs (C) in AD hippocampal tissue. The data are depicted as matrices in which each row represents one circRNA, miRNA, or mRNA and each column represents one of the hippocampal samples. Relative circRNA, miRNA, or mRNA expression is depicted according to the color scale shown at the top. Red and green represent high and low relative expression, respectively; -2.0, 0, and 2.0 are fold-changes in the corresponding spectrum. The magnitude of deviation from the median is represented by color saturation.
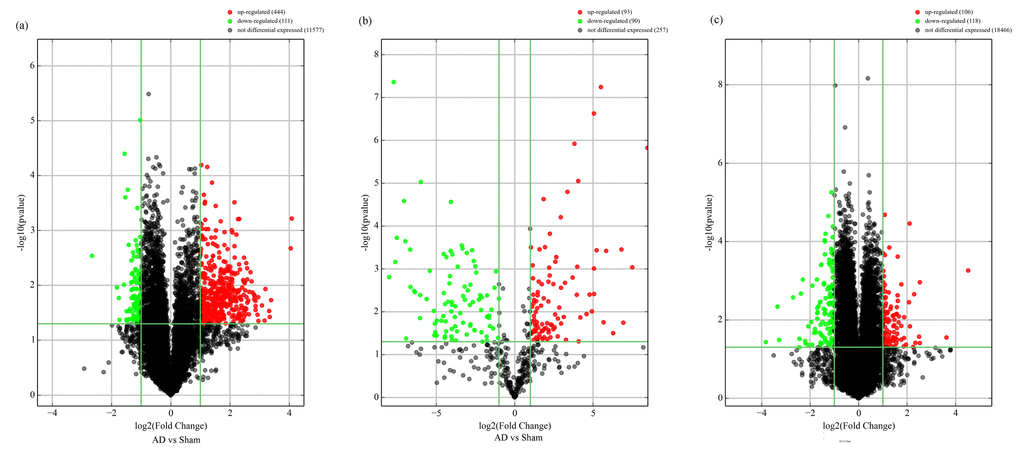
Figure 2. Volcano plot of differentially-expressed circRNAs (A), miRNAs (B), and mRNAs (C) between AD and sham hippocampal samples. Volcano plots were constructed using fold-change values and p-values. The vertical lines correspond to 2.0-fold up- and down-regulation between normal and AD samples (N vs.D), and the horizontal lines represent p-values. Red plot points represent differentially-expressed circRNAs with statistical significance.
Expression profile validation
To validate the accuracy and reliability of the microarray profiling data, some transcripts, including four circRNAs (rno_circRNA_001555, rno_circRNA_010684, rno_circRNA_01398, and rno_circRNA_017759), four miRNAs (rno-miR-181a-2-3p, rno-miR-124-3p, rno-miR-136-3p, and rno-miR-206-3p), and four mRNAs (IGF2, IGFBP2, S100a8, and IGF1) were randomly selected for quantitative real-time polymerase chain reaction (qRT-PCR) analysis in nine samples including those used for microarray analysis. As shown in Fig. 3, the microarray data were consistent with the qRT-PCR results in terms of the expression levels of the validated ncRNAs and mRNAs.
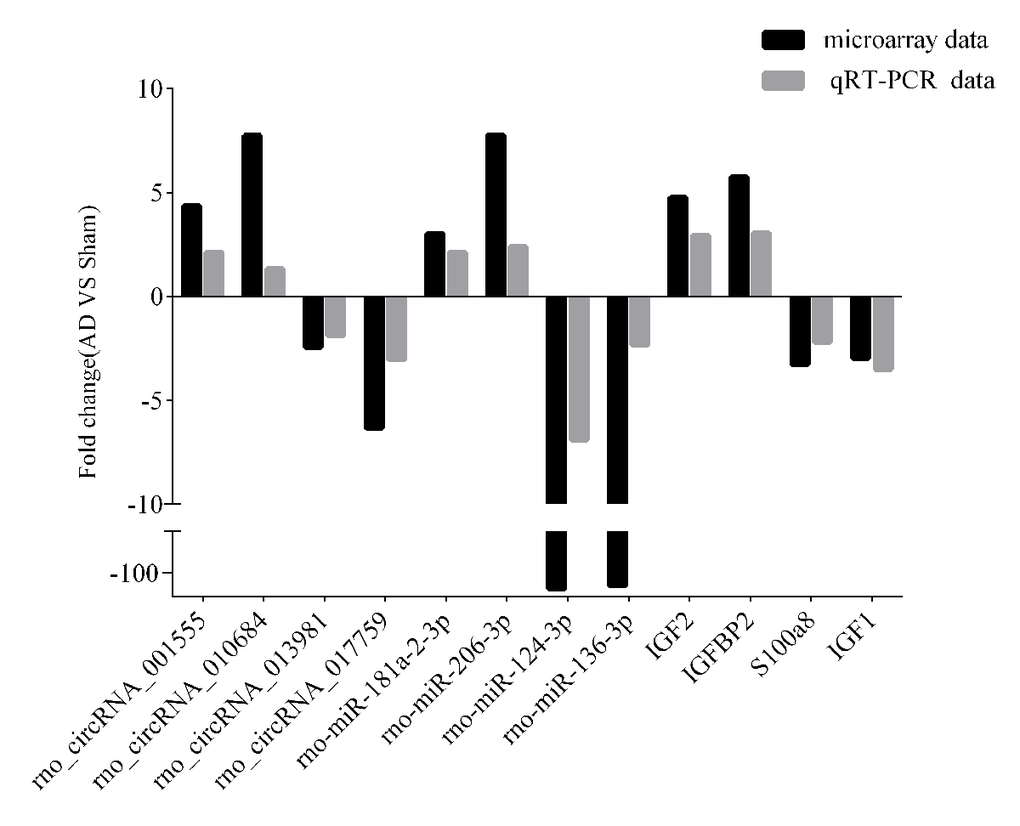
Figure 3. qRT-PCR-validated ncRNA and mRNA expression changes. Microarray validation by qRT-PCR. Expression levels of four circRNAs, four miRNAs, and four mRNAs were determined by qRT-PCR. Each assay was performed at least three times. *p < 0.05.
GO and KEGG pathway analyses of differentially-expressed mRNAs
GO and KEGG pathway analyses allow for the functional annotation of differentially-expressed mRNAs. GO analysis indicated that the most enriched mRNAs correlated with the extracellular region part (GO: 0044421) of the cellular component analysis (Figure 4a). Meanwhile, the majority of genes were related to toll-like receptor binding (GO:0035325) in the molecular functions and regulation of biological quality (GO:0065008) aspect of the biological processes analyses (Figure 4b and 4c). KEGG pathway analysis indicated that 10 KEGG pathways (p < 0.05) were associated with dysregulated mRNAs involved in neuroactive ligand-receptor interaction, AMP-activated protein kinase (AMPK) signaling pathway, longevity regulating pathway-multiple species, fatty acid elongation, inflammatory mediator regulation of transient receptor potential (TRP) channels, p53 signaling pathway, hematopoietic cell lineage, adipocytokine signaling pathway, focal adhesion and osteoclast differentiation (Figure 4d).
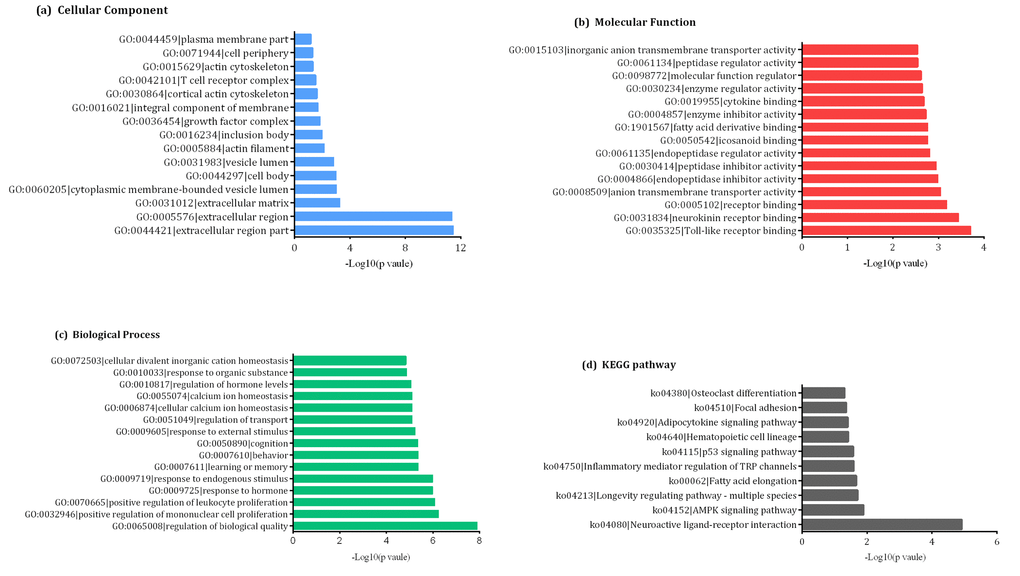
Figure 4. Gene ontology (GO) enrichment and pathway analysis of differentially- expressed mRNAs showing the most significantly enriched (-log10, p-value) GO terms of differentially-expressed mRNAs according to (A) cellular components, (B) molecular functions, and (C) biological processes. (D) The top ten enrichment scores (-log10, p-value) of significantly enriched KEGG pathways.
Prediction of circRNA-miRNA interactions
To determine the function of circRNA, interactions between circRNAs and their target miRNAs were theoretically predicted by conserved seed-matching sequences. To find the potential miRNA target, two confirmed circRNAs (rno_circRNA_008964 and rno_circRNA_017759) were selected, and circRNA-miRNA interaction was predicted using Arraystar's miRNA target prediction software based on the TargetScan and miRanda databases. The potential miRNA targets of rno_circRNA_008964 included rno-miR-216b-5p, rno-miR-181d-5p, rno-miR-337-5p, rno-miR-497-3p, and rno-miR-181b-5p (Fig. 5a). For rno_circRNA_007879, the potential miRNA targets included rno-miR-702-5p, rno-miR-3547, rno-miR-329-5p, rno-miR-203b-5p and rno-miR-3576 (Fig. 5).
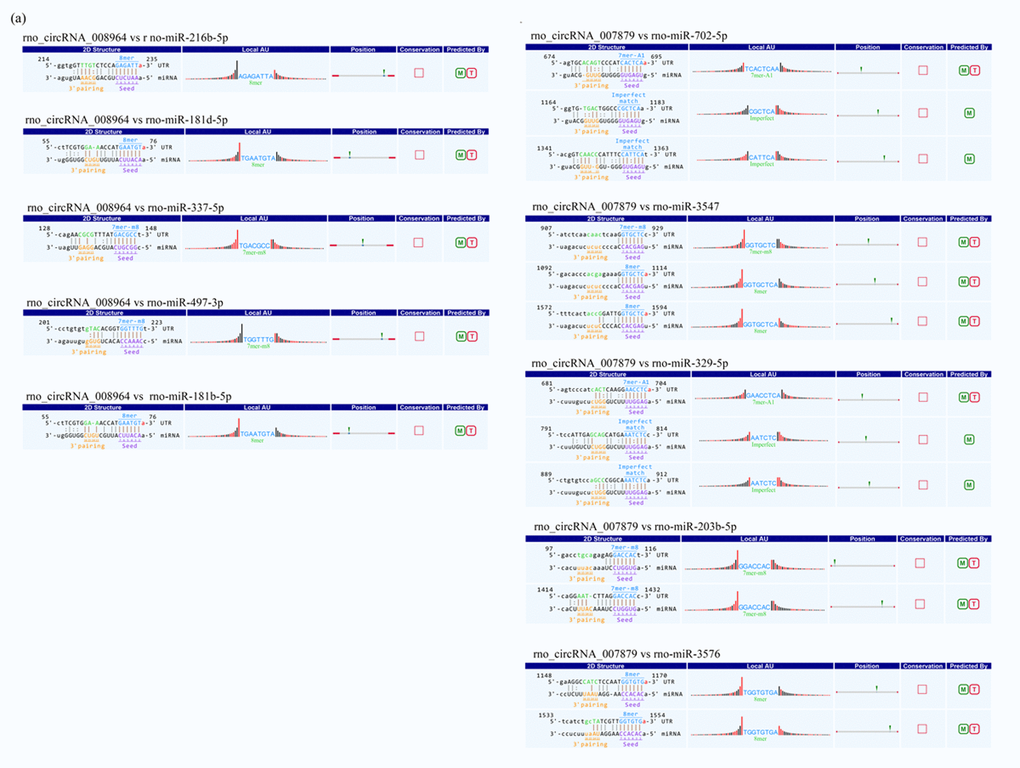
Figure 5. Example of detailed annotation for circRNA-miRNA interactions. (A) rno_circRNA_008964. (B) rno_circRNA_017759. 8mer: bases from number 2 to 8 matched perfectly, and number 1 base is A; 7mer-m8: bases from number 2 to 8 matched perfectly, and number 1 base is not A; 6mer: bases from number 2 to 7 matched perfectly, and number 1 base is not A; offset 6mer: bases from number 3 to 8 matched perfectly; imperfect match: there is imperfect base match from number 2 to 7; M: circRNA-miRNA interaction can be predicted by miRanda; T: circRNA-miRNA interaction can be predicted by TargetScan.
Construction of a circRNA-miRNA regulatory network
A circRNA-miRNA regulatory network, based on the microarray results, was constructed containing 245 circRNAs, 144 miRNAs and 279 relationships (Fig. 6). We observed that one circRNA could regulate multiple miRNAs in different ways, while one miRNA could be regulated by multiple circRNAs. For example, circRNA_34441 was co-related to four dysregulated miRNAs and MiR-153-5p was co-related with 25 dysregulated circRNAs. Thus, there appears to be a complex circRNA-miRNA regulatory network involved in the pathogenesis of AD.
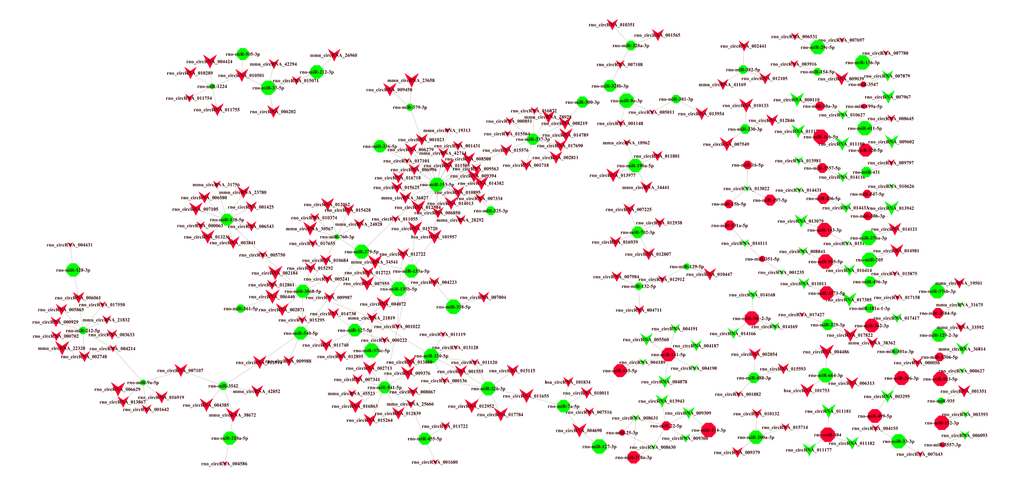
Figure 6. CircRNA-miRNA network analysis. A total of 245 circRNAs and 144 miRNAs containing 279 relationships were selected to generate a network map. The circRNA-miRNA co-expression network was constructed with Cytoscape V3.5.0 software. Within this network, V-shaped nodes represent circRNA and octagon nodes represent miRNA. Red and green represent up- and down-regulation, respectively. Node size represents p-values (larger nodes for more significant p-values).
Construction of a circRNA-miRNA-mRNA regulatory network
To explore the molecular mechanism of ncRNAs, a circRNA-miRNA-mRNA regulatory network was constructed with 140 circRNAs as decoys, 140 miRNAs as centres, and 20 mRNAs as targets based on the microarray data (Fig. 7). Because there are binding sites between circRNAs and miRNAs, circRNAs could indirectly regulate miRNA target genes by competitively binding to miRNA as a miRNA sponge. For instance, we focused on miR-7a-5p, circRNA_101834 and circRNA_004690 that could regulate AQP3 expression by competing miRNA response elements (MREs) of miR-7a-5p. These data suggested that circRNAs harbor MREs and play pivotal regulatory roles in AD.
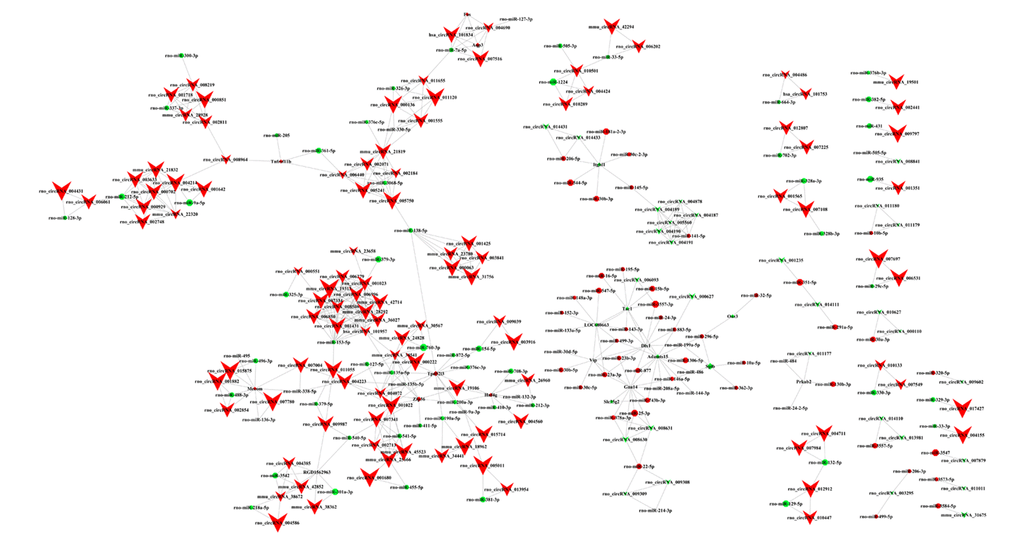
Figure 7. CircRNA-miRNA-mRNA regulatory network. The regulatory network consists of 140 circRNAs, 140 miRNAs, and 20 genes with 503 relationships. V-shaped, octagon, and diamond nodes represent circRNA, miRNA, and mRNA, respectively. Red and green represent up- and down-regulation, respectively. Node size represents p-values (larger nodes for more significant p-values).
Discussion
To the best of our knowledge, this is the first integrated microarray analysis of circRNA, miRNA and mRNA expression profiles in the hippocampus of Aβ1-42-induced AD model rats. With FC ≥ 2.0 and p-value < 0.05 thresholds, 444 up-regulated and 111 down-regulated circRNAs, 93 up-regulated and 90 down-regulated miRNAs, and 173 up-regulated and 146 down-regulated mRNAs showed significant differential expression between the AD and control groups. These transcripts are thought to be associated with the pathogenesis of AD. For instance, the S100A8 precedes Aβ plaque formation [17], IGFBP-2 drives AD neurodegeneration [18], miR-146a-5p facilitates neuroinflammation in AD pathogenesis [19], and miR-132-3p contributes to tau hyper-phosphorylation [20]. Our qRT-PCR validation showd that the qRT-PCR results and microarray data were consistent, indicating that the latter were reliable.
To better understand the biological functions and potential mechanisms of mRNAs in the pathogenesis of AD, we performed GO and KEGG pathway analysis. Among the GO terms found in this study, the extracellular region part (GO:0044421), toll-like receptor binding (GO:0035325), and the regulation of biological quality (GO:0065008) have been reported to play important roles in AD development. Remarkable among the KEGG pathways were the AMPK and p53 signaling pathways, both known to potentially mediate AD pathogenesis [21–23].
Increasing lines of evidence indicate that circRNAs can function as endogenous sponges to influence miRNA activity, thereby regulating other transcripts containing miRNA-binding sites [24,25]. Therefore, we examined circRNA-miRNA interactions and found that the majority of circRNAs contained one or more miRNA binding sites based on sequence analyses. The association of miRNAs with AD indicated that circRNAs might have a regulatory role in AD. For example, rno_circRNA_003295 is potentially able to interact with rno-miR-206-3p, rno_circRNA_002441 with miR-144-3p, and rno_circRNA_012846 with rno-miR-10a-5p. Moreover, we constructed a circRNA-miRNA regulatory network to investigate potential relationships among the circRNAs and miRNAs. Our results indicated that circRNA-miRNA regulatory networks might play important roles in the pathogenesis of AD. However, beyond acting as a miRNA sponge, circRNAs might also influence mRNA transcriptional levels by interacting with the Pol II complex in the nucleus [26], or by directly binding to RNA-binding proteins and RNA-associated proteins to form RNA-protein complexes [27]. Furthermore, circRNAs can act on gene expression trans-functionally by competing with pre-mRNA splicing machinery [28], and endogenous circRNAs can be used as templates to encode proteins [29]. Therefore, the biological function of circRNA in the pathogenesis of AD requires further investigation.
Perturbations in competing endogenous RNA (ceRNA) regulatory networks (ceRNETs) including mRNAs, miRNAs, and circRNAs have been proposed to play critical roles in the pathogenesis of human disease [30–32]. For example, the circRNA-7/miRNA-7/UBE2A signaling pathway is significantly dysregulated in AD [33,34]. The application of ceRNET analysis may provide a novel view of interplay between ncRNAs and mRNAs, thereby offering some insight into molecular pathways. Our results provide the first assessment of ceRNETs in AD and suggest that specific ceRNETs are involved in disease etiology and pathogenesis.
There are certain limitations to our study which should be considered when interpreting our findings. Firstly, the sample size was limited, which could have resulted in under- or over-estimation of the numbers of altered circRNAs, miRNAs, and mRNAs. Larger sample sizes are needed to confirm our findings. Secondly, our results refer only to hippocampal samples from Aβ1-42-induced AD rats. Further research with other AD models, using additional sample sources such as blood and cerebrospinal fluid, is now needed to more accurately capture the pathophysiology of AD. Thirdly, our analyses were performed using gene expression microarrays with limited dynamic range that lack the ability to identify novel features. RNA-sequence technology should be utilized to unravel previously inaccessible transcriptome complexities. Finally, because the functions of circRNAs and miRNAs remain largely unknown, the interpretation of our data was not straightforward. Thus, we only predicted the functions of differentially-expressed mRNAs. Future studies that overcome such limitations are now highly warranted.
In conclusion, we identified dysregulated expression profiles of circRNAs, miRNA, and mRNAs in the hippocampus of AD rats, and present an innovative data integration analysis of circRNAs, miRNAs and mRNAs. Our results indicate that ncRNAs may interact to regulate the expression of their target protein-genes involved in the pathogenesis of AD. The next step is to validate and expand these findings in future studies, which might ultimately enable us to fully elucidate the mechanisms underlying AD.
Materials and Methods
Ethics statement
All animal protocols were approved by the Central South University (Changsha, China) Institutional Review Board and were performed in compliance with the National Institutes of Health Guide for the Care and Use of Laboratory Animals. This investigation was conducted in accordance with appropriate ethical standards and the Declaration of Helsinki, as well as national and international guidelines.
Brain samples
All hippocampal tissue samples were from brain tissues obtained in our previous study [6]. Briefly, 20 adult male Sprague Dawley rats (250 ± 30 g) were randomly divided into AD (n = 10) and sham (n = 10) groups. We performed intracerebroventricular injections of Aβ1-42 oligomers into the cerebral ventricles to induce a validated AD model, as previously described [35,36]. Briefly, the animals were anaesthetized and placed in a stereotactic frame, then the Aβ1–42 oligomers were injected bilaterally into the lateral ventricles through a stainless-steel cannula.
RNA extraction
Total RNA was extracted from each hippocampal tissue sample by soaking in TRIzol Reagent (Invitrogen, Carlsbad, CA, USA) in accordance with the manufacturer’s instructions, which mainly includes homogenization, phase separation, RNA precipitation, RNA wash and RNA solubilization. RNA quantity and quality were measured using a NanoDrop ND-1000 (Thermo Scientific, Waltham, MA, USA), and RNA integrity was assessed by standard denaturing agarose gel electrophoresis.
Microarray analysis
Sample labelling and microarray hybridization for gene expression were performed according to the Agilent One-Color Microarray-Based Gene Expression Analysis protocol (Agilent Technology, Santa Clara, CA, USA), which included RNA purification, transcription into fluorescent-labeled cRNA, and hybridization onto the Rat 4x44K Gene Expression Array (Agilent). Finally, the hybridized arrays were washed, fixed, and scanned using the Agilent DNA Microarray Scanner G2505C. RNA labeling and array hybridization for miRNA analysis were conducted following the Exiqon manual (Vedbaek, Denmark). After quality control, the miRCURY™ Hy3™/Hy5™ Power labeling kit (Exiqon) was used for miRNA labeling according to the manufacturer guidelines. After stopping the labeling procedure, Hy3™-labeled samples were hybridized on the Rat miRCURY LNA™ microRNA Array 7th Gen (Exiqon), according to the array manual. The slides were scanned using the Axon GenePix 4000B microarray scanner (Axon Instruments, Foster City, CA, USA). circRNA sample preparation and microarray hybridization were performed based on Arraystar standard protocols (Super RNA Labeling Kit; Arraystar, Rockville, MD, USA). Briefly, total RNAs were digested with Rnase R (Epicentre, Inc., Madison, WI, USA) to remove linear RNAs and enrich for circular RNAs. Then, the enriched circular RNAs were amplified and transcribed into fluorescent-labeled cRNA using a random priming method (Super RNA Labeling Kit). The labeled cRNAs were hybridized onto the Arraystar Rat circRNA Array (8x15K, Arraystar). After washing the slides, the arrays were scanned using the Agilent Scanner G2505C. All data collection was performed using Agilent Feature Extraction software (version 11.0.1.1). KangChen Bio-tech (Shanghai, China) performed all microarray analyses.
Quantitative real-time polymerase chain reaction (qRT-PCR) validation
As previously described [31], total RNA was isolated using TRIzol Reagent, and then reverse-transcribed into cDNA using SuperScript III Reverse Transcriptase (Invitrogen) according to the manufacturer’s instruction. An Applied Biosystems ViiA™7 Real-Time PCR System and 2× PCR Master Mix were used to perform qRT-PCR (Arraystar) in accordance with the manufacturer's instructions. The relative circRNA and mRNA expression levels were calculated using the 2-ΔΔCt method and were normalized to GAPDH as an endogenous reference transcript [37]. miRNA expression levels were normalized to that of U6. The specific primers for each gene are listed in Table 4. Data shown represent the means of three experiments.
Table 4. Primers designed for qRT-PCR validation of candidate circRNAs, miRNAs, and mRNAs.
| Forward primer | Reverse Primer | PrProduct length (bp) | Tm(°C) | |
| rno_circRNA_001555 | 5’- ATGAGCAATGACTCCCCAGAA-3’ | 5’- GAGAGTATGGTCTGTTGCGTTG-3’ | 60 | 60 |
| rno_circRNA_010684 | 5’- TGGATCTAAAGCAGCTACAGAA-3’ | 5’- CTTTGGTTCCATTCATCCTTAT-3’ | 82 | 60 |
| rno_circRNA_013981 | 5’- CTACCTTGAGCTGCACATACTG-3’ | 5’- TTTGTCCACCACCTTTGCT-3’ | 58 | 60 |
| rno_circRNA_017759 | 5’- GAGTATCCACTGGTGACGACTG-3’ | 5’- AATATGCTGATCTTGTTTTCACC-3’ | 69 | 60 |
| rno-miR-181a-2-3p | 5’-GGACCACTGACCGTTGAC-3’ | 5’-CAGTGCGTGTCGTGGAG-3’ | 64 | 60 |
| rno-miR-206-3p | 5’- TGGGGTGGAATGTAAGGAAGT-3’ | 5’-CAGTGCGTGTCGTGGAGT-3’ | 65 | 60 |
| rno-miR-124-3p | 5’-GGGTAAGGCACGCGGT-3’ | 5’-GTGCGTGTCGTGGAGTCG-3’ | 61 | 60 |
| rno-miR-136-3p | 5’- GGGGACATCATCGTCTCAAAT -3’ | 5’-CAGTGCGTGTCGTGGAGT-3’ | 65 | 60 |
| IGFBP2 | 5’- TCTACTCCCTGCATATCCCCA-3’ | 5’- GGTTCACACACCAGCACTCC-3’ | 105 | 60 |
| IGF2 | 5’- GCTTGTTGACACGCTTCAGTT-3’ | 5’- TAGACACGTCCCTCTCGGA-3’ | 179 | 60 |
| IGF1 | 5’- GGGCATTGTGGATGAGTGTTG -3’ | 5’- GCTGGGACTTCTGAGTCTTGG -3’ | 148 | 60 |
| S100A8 | 5’-GGGAATCACCATGCCCTCTAC-3’ | 5’-GCCCACCCTTATCACCAACAC-3’ | 168 | 60 |
GO annotations and KEGG pathway analyses
GO annotations and KEGG pathway analyses were performed to investigate the roles of all differentially-expressed mRNAs, as previously described [38,39]. Briefly, GO analysis was applied to elucidate genetic regulatory networks of interest by forming hierarchical categories according to the molecular functions, biological processes, and cellular component aspects of the differentially expressed genes (http://www.geneontology.org). The -log10 (p-value) denotes enrichment scores that represent the significance of GO term enrichment among differentially-expressed genes. KEGG pathway analyses were performed to explore significant pathways associated with the differentially-expressed genes (http://www.genome.jp/kegg/). The -log10 (p-value) denotes an enrichment score for the significance of pathway correlations.
Annotation for circRNA-miRNA interaction
As described previously [40,41], circRNA-miRNA interactions were predicted with Arraystar's home-made miRNA target prediction software based on TargetScan (http://www.targetscan.org/) and miRanda (http://microrna.org/). The top five putative target miRNAs were identified. Then, we constructed a circRNA-miRNA regulatory network using the Cytoscape software V3.5.0 (San Diego, CA, USA).
CircRNA-associated ceRNA network construction
The circRNA-associated ceRNA network was constructed and visually displayed using the Cytoscape software V3.5.0 (San Diego, CA, USA) based on microarray data analysis results, as previous described [42]. Different shapes and colors represent different RNA types and regulated relationships, respectively. Node size was inversely proportion to the p-value.
Statistical analysis
All data were analysed using SPSS version 22.0 software (IBM Corp. Armonk, NY, USA) and presented as mean ± standard error of the mean (SEM). Student’s t-tests were used for comparisons between two groups, whereas one-way analysis of variance was performed for repeated measures. False discovery rates were calculated to correct p-values. Differences with p < 0.05 were considered to be statistically significant. Fold changes (FCs) and Student’s t-tests were used to determine the statistical significance of the microarray results. FC ≥ 2 and p < 0.05 were used as thresholds for designating differentially-expressed ncRNAs and mRNAs.
Acknowledgements
We thank Mr. Xing Xiang from KangChen Bio-tech Inc. for technical advice relating to our bioinformatics analysis.
Conflicts of Interest
The authors declare that they have no competing interests.
Funding
This work was financially supported by the National Natural Science Foundation of China (Nos. 81373705, 81603670, 81601140, 81673951) and the Hunan Provincial Natural Science Foundation of China (No. 2017JJ3459).
References
- 1. Jia J, Wei C, Chen S, Li F, Tang Y, Qin W, Zhao L, Jin H, Xu H, Wang F, Zhou A, Zuo X, Wu L, et al. The cost of Alzheimer’s disease in China and re-estimation of costs worldwide. Alzheimers Dement. 2018; 14:483–91. https://doi.org/10.1016/j.jalz.2017.12.006 [PubMed]
- 2. Zádori D, Veres G, Szalárdy L, Klivényi P, Vécsei L. Alzheimer’s Disease: Recent Concepts on the Relation of Mitochondrial Disturbances, Excitotoxicity, Neuroinflammation, and Kynurenines. J Alzheimers Dis. 2018; 62:523–47. https://doi.org/10.3233/JAD-170929 [PubMed]
- 3. Association As. 2017 Alzheimer’s disease facts and figures. Alzheimers Dement. 2017; 13:325–73. https://doi.org/10.1016/j.jalz.2017.02.001
- 4. Idda ML, Munk R, Abdelmohsen K, Gorospe M. Noncoding RNAs in Alzheimer’s disease. Wiley Interdiscip Rev RNA. 2018; 9:1–13. https://doi.org/10.1002/wrna.1463 [PubMed]
- 5. Millan MJ. Linking deregulation of non-coding RNA to the core pathophysiology of Alzheimer’s disease: an integrative review. Prog Neurobiol. 2017; 156:1–68. https://doi.org/10.1016/j.pneurobio.2017.03.004 [PubMed]
- 6. Yang B, Xia ZA, Zhong B, Xiong X, Sheng C, Wang Y, Gong W, Cao Y, Wang Z, Peng W. Distinct Hippocampal Expression Profiles of Long Non-coding RNAs in an Alzheimer’s Disease Model. Mol Neurobiol. 2017; 54:4833–46. https://doi.org/10.1007/s12035-016-0038-5 [PubMed]
- 7. You X, Vlatkovic I, Babic A, Will T, Epstein I, Tushev G, Akbalik G, Wang M, Glock C, Quedenau C, Wang X, Hou J, Liu H, et al. Neural circular RNAs are derived from synaptic genes and regulated by development and plasticity. Nat Neurosci. 2015; 18:603–10. https://doi.org/10.1038/nn.3975 [PubMed]
- 8. Rybak-Wolf A, Stottmeister C, Glažar P, Jens M, Pino N, Giusti S, Hanan M, Behm M, Bartok O, Ashwal-Fluss R, Herzog M, Schreyer L, Papavasileiou P, et al. Circular RNAs in the Mammalian Brain Are Highly Abundant, Conserved, and Dynamically Expressed. Mol Cell. 2015; 58:870–85. https://doi.org/10.1016/j.molcel.2015.03.027 [PubMed]
- 9. Hansen TB, Jensen TI, Clausen BH, Bramsen JB, Finsen B, Damgaard CK, Kjems J. Natural RNA circles function as efficient microRNA sponges. Nature. 2013; 495:384–88. https://doi.org/10.1038/nature11993 [PubMed]
- 10. Du WW, Zhang C, Yang W, Yong T, Awan FM, Yang BB. Identifying and Characterizing circRNA-Protein Interaction. Theranostics. 2017; 7:4183–91. https://doi.org/10.7150/thno.21299 [PubMed]
- 11. Rong D, Sun H, Li Z, Liu S, Dong C, Fu K, Tang W, Cao H. An emerging function of circRNA-miRNAs-mRNA axis in human diseases. Oncotarget. 2017; 8:73271–81. https://doi.org/10.18632/oncotarget.19154 [PubMed]
- 12. Lukiw W, Zhao Y, Rogaev E, Bhattacharjee S. A Circular RNA (circRNA) ciRS-7 in Alzheimer’s disease (AD) targets miRNA-7 trafficking and promotes deficits in the expression of the ubiquitin conjugase (UBE2A) and the epidermal growth factor receptor (EGFR). The FASEB journal. 2016; 30:587.1. https://www.fasebj.org/doi/abs/10.1096/fasebj.30.1_supplement.587.1.
- 13. Lukiw WJ. Circular RNA (circRNA) in Alzheimer’s disease (AD). Front Genet. 2013; 4:307. https://doi.org/10.3389/fgene.2013.00307 [PubMed]
- 14. Zhang S, Zhu D, Li H, Li H, Feng C, Zhang W. Characterization of circRNA-Associated-ceRNA Networks in a Senescence-Accelerated Mouse Prone 8 Brain. Mol Ther. 2017; 25:2053–61. https://doi.org/10.1016/j.ymthe.2017.06.009 [PubMed]
- 15. Huang JL, Qin MC, Zhou Y, Xu ZH, Yang SM, Zhang F, Zhong J, Liang MK, Chen B, Zhang WY, Wu DP, Zhong ZG. Comprehensive analysis of differentially expressed profiles of Alzheimer’s disease associated circular RNAs in an Alzheimer’s disease mouse model. Aging (Albany NY). 2018; 10:253–65. https://doi.org/10.18632/aging.101387 [PubMed]
- 16. McLarnon JG, Ryu JK. Relevance of abeta1-42 intrahippocampal injection as an animal model of inflamed Alzheimer’s disease brain. Curr Alzheimer Res. 2008; 5:475–80. https://doi.org/10.2174/156720508785908874 [PubMed]
- 17. Lodeiro M, Puerta E, Ismail MA, Rodriguez-Rodriguez P, Rönnbäck A, Codita A, Parrado-Fernandez C, Maioli S, Gil-Bea F, Merino-Serrais P, Cedazo-Minguez A. Aggregation of the Inflammatory S100A8 Precedes Aβ Plaque Formation in Transgenic APP Mice: Positive Feedback for S100A8 and Aβ Productions. J Gerontol A Biol Sci Med Sci. 2017; 72:319–28. https://doi.org/10.1093/gerona/glw073 [PubMed]
- 18. Lane EM, Hohman TJ, Jefferson AL, and Alzheimer’s Disease Neuroimaging Initiative. Insulin-like growth factor binding protein-2 interactions with Alzheimer’s disease biomarkers. Brain Imaging Behav. 2017; 11:1779–86. https://doi.org/10.1007/s11682-016-9636-0 [PubMed]
- 19. Zhang B, Wang A, Xia C, Lin Q, Chen C. A single nucleotide polymorphism in primary-microRNA-146a reduces the expression of mature microRNA-146a in patients with Alzheimer’s disease and is associated with the pathogenesis of Alzheimer’s disease. Mol Med Rep. 2015; 12:4037–42. https://doi.org/10.3892/mmr.2015.3968 [PubMed]
- 20. Lau P, Bossers K, Janky R, Salta E, Frigerio CS, Barbash S, Rothman R, Sierksma AS, Thathiah A, Greenberg D, Papadopoulou AS, Achsel T, Ayoubi T, et al. Alteration of the microRNA network during the progression of Alzheimer’s disease. EMBO Mol Med. 2013; 5:1613–34. https://doi.org/10.1002/emmm.201201974 [PubMed]
- 21. Cai Z, Yan LJ, Li K, Quazi SH, Zhao B. Roles of AMP-activated protein kinase in Alzheimer’s disease. Neuromolecular Med. 2012; 14:1–14. https://doi.org/10.1007/s12017-012-8173-2 [PubMed]
- 22. Checler F, Alves da Costa C. p53 in neurodegenerative diseases and brain cancers. Pharmacol Ther. 2014; 142:99–113. https://doi.org/10.1016/j.pharmthera.2013.11.009 [PubMed]
- 23. Merlo P, Frost B, Peng S, Yang YJ, Park PJ, Feany M. p53 prevents neurodegeneration by regulating synaptic genes. Proc Natl Acad Sci USA. 2014; 111:18055–60. https://doi.org/10.1073/pnas.1419083111 [PubMed]
- 24. Tay Y, Rinn J, Pandolfi PP. The multilayered complexity of ceRNA crosstalk and competition. Nature. 2014; 505:344–52. https://doi.org/10.1038/nature12986 [PubMed]
- 25. Xie L, Mao M, Xiong K, Jiang B. Circular RNAs: A Novel Player in Development and Disease of the Central Nervous System. Front Cell Neurosci. 2017; 11:354. https://doi.org/10.3389/fncel.2017.00354 [PubMed]
- 26. Zhang Y, Zhang XO, Chen T, Xiang JF, Yin QF, Xing YH, Zhu S, Yang L, Chen LL. Circular intronic long noncoding RNAs. Mol Cell. 2013; 51:792–806. https://doi.org/10.1016/j.molcel.2013.08.017 [PubMed]
- 27. Du WW, Yang W, Liu E, Yang Z, Dhaliwal P, Yang BB. Foxo3 circular RNA retards cell cycle progression via forming ternary complexes with p21 and CDK2. Nucleic Acids Res. 2016; 44:2846–58. https://doi.org/10.1093/nar/gkw027 [PubMed]
- 28. Ashwal-Fluss R, Meyer M, Pamudurti NR, Ivanov A, Bartok O, Hanan M, Evantal N, Memczak S, Rajewsky N, Kadener S. circRNA biogenesis competes with pre-mRNA splicing. Mol Cell. 2014; 56:55–66. https://doi.org/10.1016/j.molcel.2014.08.019 [PubMed]
- 29. Legnini I, Di Timoteo G, Rossi F, Morlando M, Briganti F, Sthandier O, Fatica A, Santini T, Andronache A, Wade M, Laneve P, Rajewsky N, Bozzoni I. Circ-ZNF609 Is a Circular RNA that Can Be Translated and Functions in Myogenesis. Mol Cell. 2017; 66:22–37.e9. https://doi.org/10.1016/j.molcel.2017.02.017 [PubMed]
- 30. Guo LL, Song CH, Wang P, Dai LP, Zhang JY, Wang KJ. Competing endogenous RNA networks and gastric cancer. World J Gastroenterol. 2015; 21:11680–87. https://doi.org/10.3748/wjg.v21.i41.11680 [PubMed]
- 31. Jin X, Feng CY, Xiang Z, Chen YP, Li YM. CircRNA expression pattern and circRNA-miRNA-mRNA network in the pathogenesis of nonalcoholic steatohepatitis. Oncotarget. 2016; 7:66455–67. https://doi.org/10.18632/oncotarget.12186 [PubMed]
- 32. Chen L, Zhang S, Wu J, Cui J, Zhong L, Zeng L, Ge S. circRNA_100290 plays a role in oral cancer by functioning as a sponge of the miR-29 family. Oncogene. 2017; 36:4551–61. https://doi.org/10.1038/onc.2017.89 [PubMed]
- 33. Zhao Y, Alexandrov PN, Jaber V, Lukiw WJ. Deficiency in the Ubiquitin Conjugating Enzyme UBE2A in Alzheimer’s Disease (AD) is Linked to Deficits in a Natural Circular miRNA-7 Sponge (circRNA; ciRS-7). Genes (Basel). 2016; 7:1–9. https://doi.org/10.3390/genes7120116 [PubMed]
- 34. Lukiw WJ, Zhao Y, Pogue AI, Bhattacharjee S, Dua P. Circular RNA (circRNA-7; ciRS-7) impacts microrna-7 trafficking and downregulates the ubiquitin-conjugating enzyme E2A (UBE2A) in sporadic Alzheimer’s disease (AD) brain. Alzheimers Dement. 2015; 11:624. https://doi.org/10.1016/j.jalz.2015.06.878
- 35. Xia Z, Peng W, Cheng S, Zhong B, Sheng C, Zhang C, Gong W, Cheng S, Li J, Wang Z. Naoling decoction restores cognitive function by inhibiting the neuroinflammatory network in a rat model of Alzheimer’s disease. Oncotarget. 2017; 8:42648–63. https://doi.org/10.18632/oncotarget.17337 [PubMed]
- 36. Sheng C, Xu P, Zhou K, Deng D, Zhang C, Wang Z. Icariin Attenuates Synaptic and Cognitive Deficits in an Aβ1-42-Induced Rat Model of Alzheimer’s Disease. BioMed Res Int. 2017; 2017:7464872. https://doi.org/10.1155/2017/7464872 [PubMed]
- 37. Gebhardt FM, Scott HA, Dodd PR. Housekeepers for accurate transcript expression analysis in Alzheimer’s disease autopsy brain tissue. Alzheimers Dement. 2010; 6:465–74. https://doi.org/10.1016/j.jalz.2009.11.002 [PubMed]
- 38. Chen R, Liu L, Xiao M, Wang F, Lin X. Microarray expression profile analysis of long noncoding RNAs in premature brain injury: A novel point of view. Neuroscience. 2016; 319:123–33. https://doi.org/10.1016/j.neuroscience.2016.01.033 [PubMed]
- 39. Zhao Z, Bai J, Wu A, Wang Y, Zhang J, Wang Z, Li Y, Xu J, Li X. Co-LncRNA: investigating the lncRNA combinatorial effects in GO annotations and KEGG pathways based on human RNA-Seq data. Database (Oxford). 2015; 2015:2015. https://doi.org/10.1093/database/bav082 [PubMed]
- 40. Lin SP, Ye S, Long Y, Fan Y, Mao HF, Chen MT, Ma QJ. Circular RNA expression alterations are involved in OGD/R-induced neuron injury. Biochem Biophys Res Commun. 2016; 471:52–56. https://doi.org/10.1016/j.bbrc.2016.01.183 [PubMed]
- 41. Zhou J, Xiong Q, Chen H, Yang C, Fan Y. Identification of the Spinal Expression Profile of Non-coding RNAs Involved in Neuropathic Pain Following Spared Nerve Injury by Sequence Analysis. Front Mol Neurosci. 2017; 10:91. https://doi.org/10.3389/fnmol.2017.00091 [PubMed]
- 42. Liu W, Zhang J, Zou C, Xie X, Wang Y, Wang B, Zhao Z, Tu J, Wang X, Li H, Shen J, Yin J. Microarray Expression Profile and Functional Analysis of Circular RNAs in Osteosarcoma. Cell Physiol Biochem. 2017; 43:969–85. https://doi.org/10.1159/000481650 [PubMed]