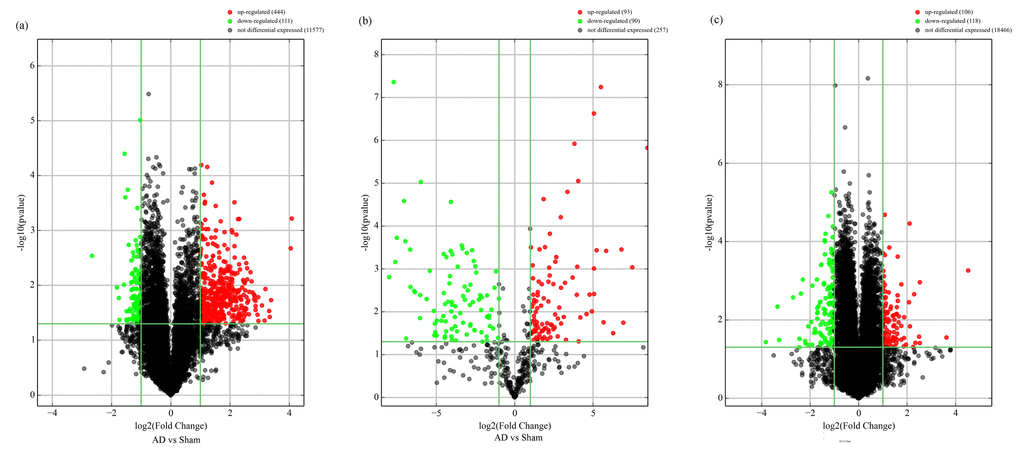
Figure 2.Volcano plot of differentially-expressed circRNAs (A), miRNAs (B), and mRNAs (C) between AD and sham hippocampal samples. Volcano plots were constructed using fold-change values and p-values. The vertical lines correspond to 2.0-fold up- and down-regulation between normal and AD samples (N vs.D), and the horizontal lines represent p-values. Red plot points represent differentially-expressed circRNAs with statistical significance.