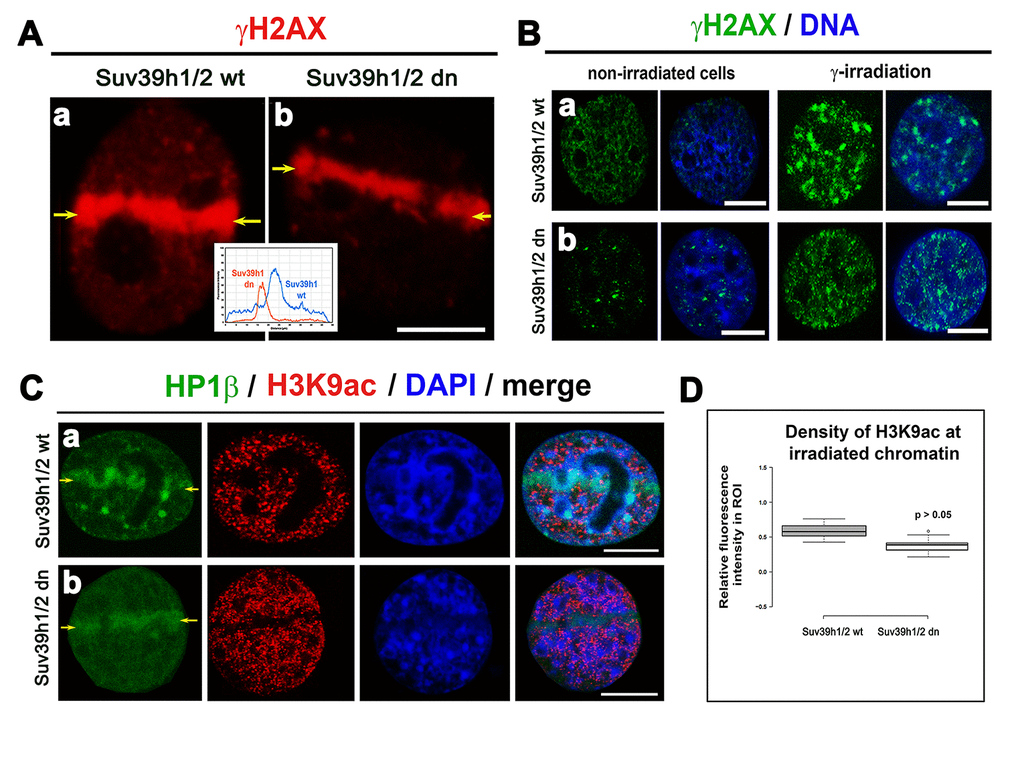
Figure 4.The level of γH2AX in irradiated chromatin. Recruitment of HP1β protein at γH2AX-positive DNA lesions and H3K9 deacetylation in UV-damaged chromatin. (A) Analysis of the level of γH2AX (red) in (a) Suv39h1/h2 wt and (b) Suv39h1/h2-deficient fibroblasts (MEFs). The appearance of γH2AX (red) was studied in micro-irradiated ROIs (see yellow arrows) induced by UVA laser (355 mm). (B) Levels of γH2AX (green) in non-irradiated and γ-irradiated (a) Suv39h1/h2 wt and (b) Suv39h1/h2 dn MEFs. Whole cell populations were irradiated by γ-rays. DAPI (blue) was used as a counterstain. Scale bars represent 10 µm. (C) Accumulation of HP1β (green) and the level of H3K9 deacetylation (red) in locally micro-irradiated (a) Suv39h1/h2 wt and (b) Suv39h1/h2 dn MEFs. DAPI was used as a counterstain of a whole nuclear volume. (D) Quantification of H3K9ac (red) in micro-irradiated chromatin showed an identical decrease of H3K9ac in micro-irradiated regions of interest (ROIs shown by yellow arrows in panels (Ca, b). Studies were performed in locally micro-irradiated Suv39h1/h2 wt and Suv39h1/h2 dn MEFs. Scale bars are 10 µm.