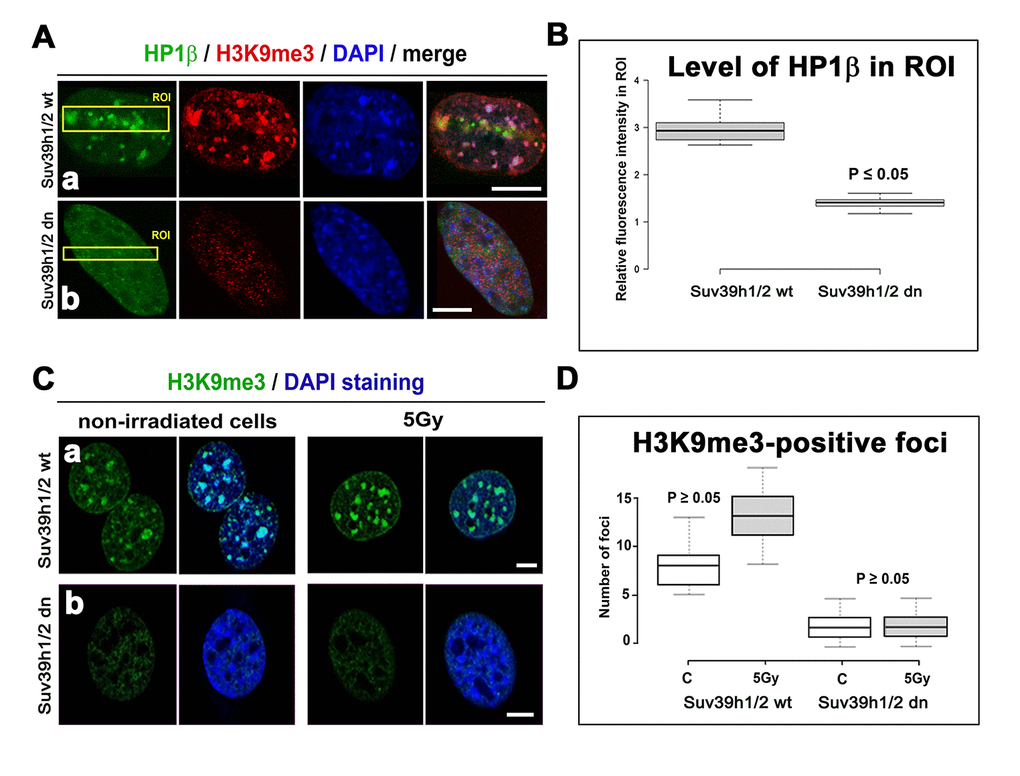
Figure 5.Accumulation of HP1β and H3K9 tri-methylation (red) in locally micro-irradiated genomic region of Suv39h1/h2 wt and Suv39h1/h2 dn MEFs. (Aa) The fluorescence of GFP-tagged HP1β (green) was decreased in regions of interest (ROIs are shown by yellow rectangles) in Suv39h1/h2 dn cells compared with the wt counterpart. The level of H3K9me3 was high in the chromocenters of locally micro-irradiated wt cells. H3K9me3 was very low in Suv39h1/h2 dn cells. (Ab) A decrease in GFP-tagged HP1β in irradiated ROI of Suv39h1/h2 dn cells. (B) Quantification of HP1β in UVA-irradiated ROI in Suv39h1/h2 wt and Suv39h1/h2 dn cells. Difference in the fluorescence intensity in ROI was statistically significant as shown by statistical analysis at P≤0.05 (Student’s t-test). (C) Nuclear distribution pattern of H3K9me3 (green) in non-irradiated and γ-irradiated Suv39h1/h2 wt and Suv39h1/h2 dn MEFs. Wild-type MEFs were characterized by H3K9me3-positivity in chromocenters (clusters of centromeric heterochromatin), while H3K9me3 was low in nuclei of Suv39h1/h2 dn cells. Scale bars are 10 µm. (D) Quantification of H3K9me3-positive foci in non-irradiated and γ-irradiated Suv39h1/h2 wt and Suv39h1/h2 dn MEFs. Irradiation by γ-rays did not significantly affect a number of H3K9me-positive foci, as shown by statistical analysis (P≥0.05); Student’s t-test was used.