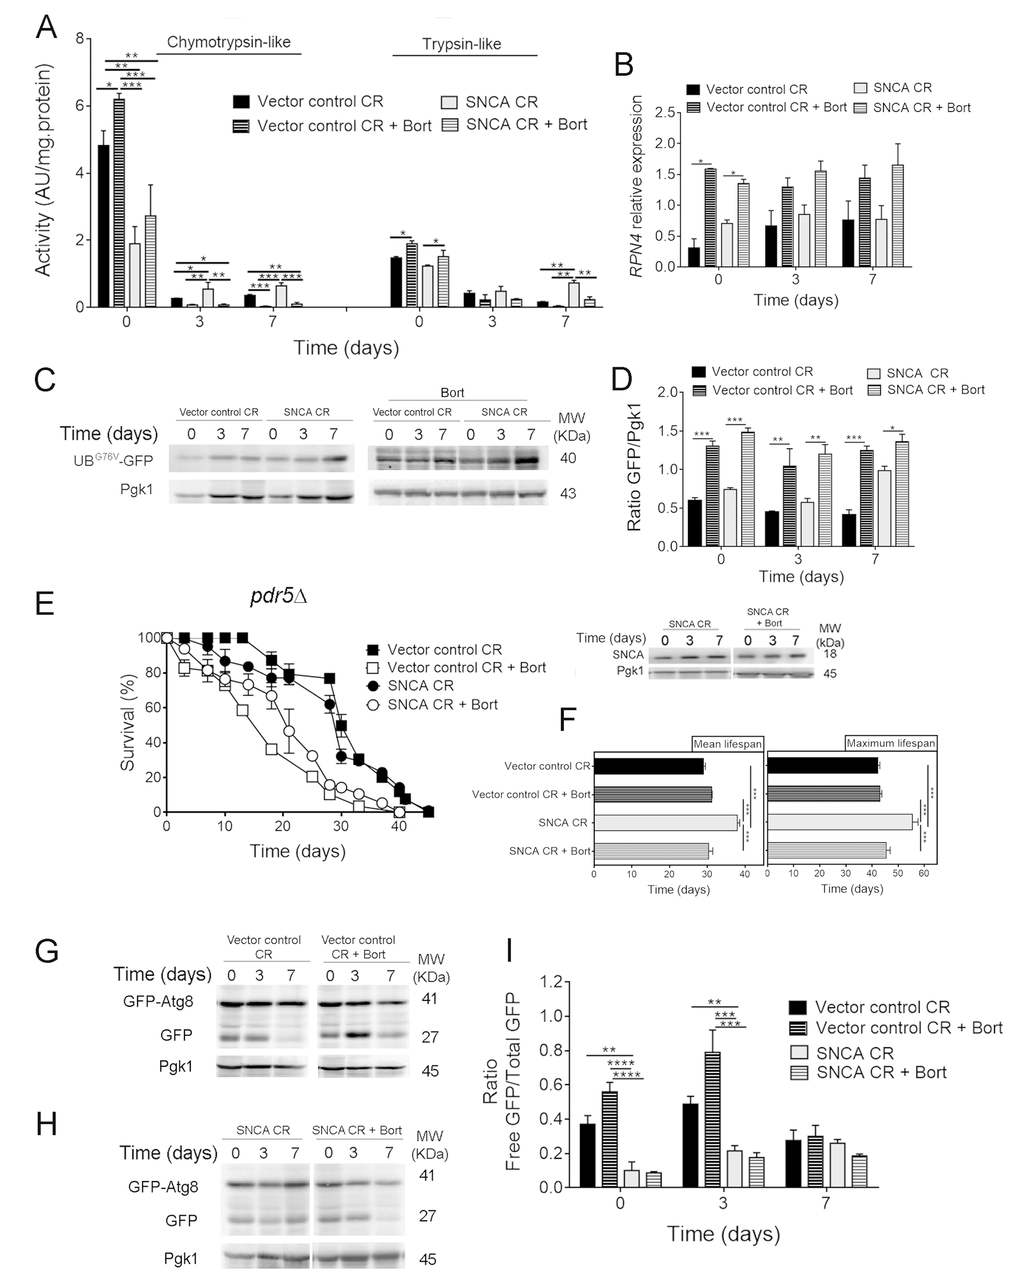
Figure 3.Pharmacological inhibition of the ubiquitin-proteasome system activity decreases lifespan of α-synuclein (SNCA)-expressing cells grown under caloric restriction but has no major impact on autophagy. (A) Chymotrypsin- and trypsin like activities. The assay was normalized to the total protein amount. Significance was determined by two-way ANOVA (*p≤0.05, **p≤0.01, ***p≤0.001) between cells grown under CR (0.5% glucose) conditions expressing vector control or SNCA in the presence or absence of bortezomib (Bort). (B) RPN4 mRNA relative expression levels as described in the legend of Figure 1. (C) UPS activity measured by monitoring the ubiquitin/proteasome-dependent proteolysis of the short-lived protein UBG76V-GFP. GFP was detected by Western blotting using a GFP-specific antibody. (D) Graphical representation of GFP/Pgk1 obtained by densitometric analysis. Statistical significance represented in (B) and (D) was determined by Student's t-test (*p≤0.05, **p≤0.01, ***p≤0.001) comparing caloric restricted vector control or SNCA-expressing cells in the presence or absence of Bort. (E) Chronological lifespan (CLS) and SNCA levels of pdr5Δ cells expressing SNCA grown under CR conditions, in the presence or absence of Bort. (F) Mean (50% survival) and maximum (10% survival) lifespans determined from curve fitting of the survival data from CLS. Significance was determined by two-way ANOVA (***p≤0.001) between cells grown under CR conditions expressing vector control or SNCA in the presence or absence of Bort. Autophagy flux assessed by the GFP-Atg8 processing assay (immunoblotting analysis with antibody against GFP) of caloric restricted cells expressing vector control (G) or SNCA (H) in the absence or presence of Bort. Blots represented in (G) are from the same gel, as in (H). (I) Densitometric analysis of the ratio between the free GFP versus the total GFP. Bands were quantified by Quantity One software. Significance of the data was determined by two-way ANOVA (**p≤0.01, ***p≤0.001, ****p≤0.0001) between cells grown under CR conditions expressing vector control or SNCA in the presence or absence of Bort. Data represents mean ± SEM of at least three biological independent replicas. The error bars represent the standard error of the mean (SEM).