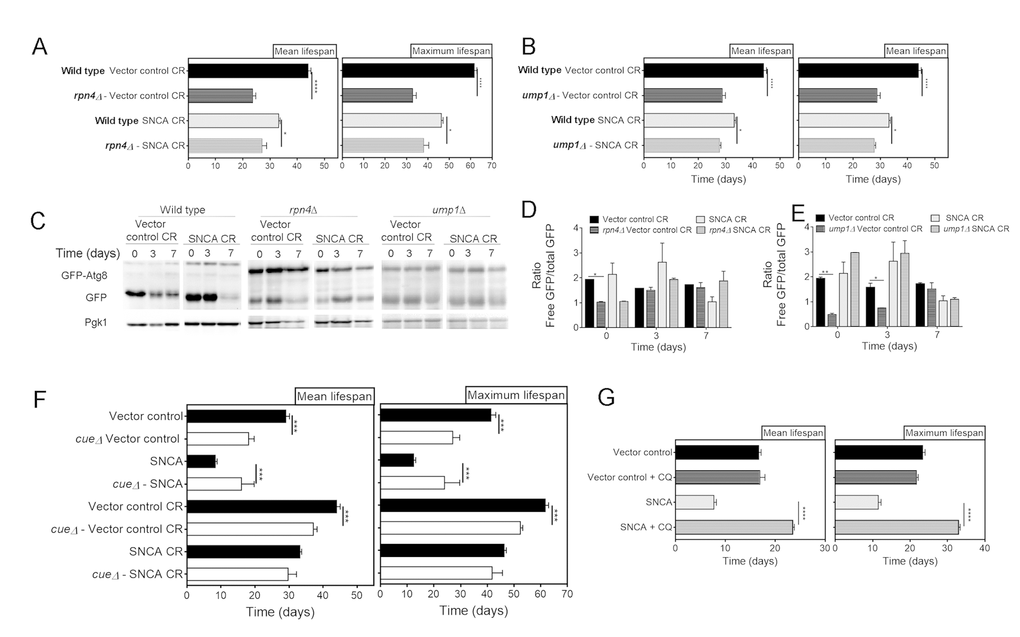
Figure 4.Genetic inhibition of the ubiquitin-proteasome system activity decreases lifespan of α-synuclein (SNCA)-expressing cells grown under caloric restriction conditions but has no major impact on autophagy. Mean (50% survival) and maximum (10% survival) lifespans determined from curve fitting of the survival data from CLS of caloric restricted vector control and SNCA expressing wild type cells compared with RPN4 (A) and UMP1 (B) deleted cells. (C) Autophagy flux assessed by the GFP-Atg8 processing assay (immunoblotting analysis with antibody against GFP) of wild type, rpn4Δ and ump1Δ caloric restricted cells expressing vector control or SNCA. Blots from same strain were run in the same gel. Densitometric analysis of the ratio between the free GFP versus the total GFP of rpn4Δ (D) and ump1Δ (E) cells. Data from wild type cells is repeated in (D) and (E) for easier interpretation. Bands were quantified by Quantity One software. (F) Mean and maximum lifespans determined from curve fitting of the survival data from CLS of wild type and cue5Δ cells expressing the vector control or SNCA in normal (2% glucose) or CR (0.5% glucose) growth conditions. (G) Mean and maximum lifespans determined from curve fitting of the survival data from CLS of wild type cells expressing the vector control or SNCA in the absence or presence of chloroquine (CQ). Significance was determined by Student's t-test (*p≤0.05, **p≤0.01, ***p≤0.001, ****p≤0.0001) comparing wild type with each mutant strain in the same conditions. For (G) the comparison was done between vector control or SNCA-expressing cells in the presence or absence of CQ. Data represents mean ± SEM of at least three biological independent replicas. The error bars represent the standard error of the mean (SEM).