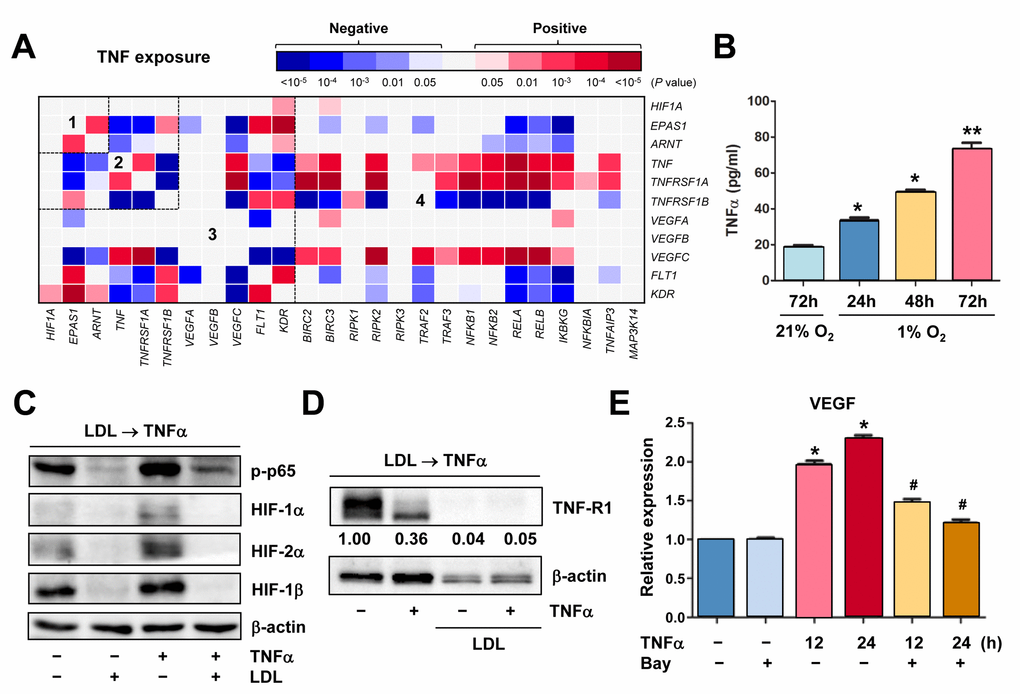
Figure 5.Hypoxia induces autocrine of TNFα in ECs, which in turn activates HIFs and NF-κB to produce VEGF. (A) Using the same approach as described in Figure 1A and 1B, the heatmap was generated by analyzing a dataset involving gene expression profiling (GEP) in HUVECs stimulated by TNFα (dataset, Exp HUVEC TNF-alpha - Kodama - 25 - MAS5.0 - u133p2). Numbers in the heatmaps indicate the areas (outlined by dash line) clustered for each pathway. (B) HUVECs were cultured under hypoxic (1% O2) or normoxic (21% O2) condition as described in Figure 2C, an ELISA assay was performed to determine absolute amount of TNFα (pg/ml) in medium harvested at the indicated intervals. Values represent the means ± SD for at least three independent experiments performed in triplicate. *P < 0.05 and **P < 0.01 for comparison with control (72 hrs under 21% O2). (C, D) HUVECs were pre-treated with LDL (100 μg/ml) for 48 hrs, followed by TNFα (50 ng/ml) for additional intervals as below, after which Western blot analysis was performed to monitor S536 phosphorylation of NF-κB p65 (5 min) and expression of HIFs (C, 4 hrs) and TNF-R1 (D, 4 hrs). Blots for TNF-R1 were densitometrically quantified by using ImageJ software. Values indicate fold change after normalization to β-actin. (E) After pre-treated with the IKK inhibitor Bay 11-7082 (10 μM) for 4 hrs, HUVECs were exposed to TNFα (50 ng/ml) for additional 24 hrs. Real-time PCR analysis was then performed to determine expression of VEGF in ECs the indicated intervals. Values represent the means ± SD for at least three independent experiments performed in triplicate. *P < 0.05 for comparison with untreated control; #P < 0.05 for comparison with TNFα alone at the same time point.