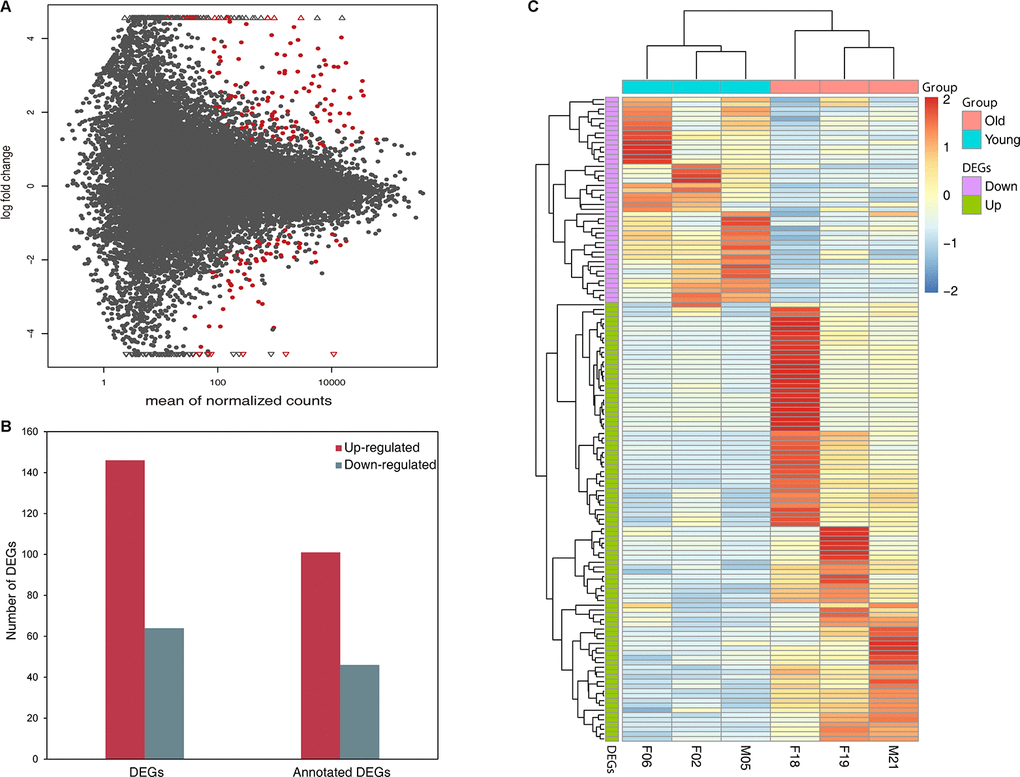
Figure 1.Differentially expressed genes in young group compared with old group(A) MA plot showing the distribution of gene expression plotted against log2 fold change for each gene. Red dots indicate differentially expressed genes (FDR ≤ 0.05), black dots indicate non-differentially expressed genes. (B) Number of up- and down-regulated DEGs and annotated DEGs. (C) Heat map plot of DEGs using TPM expression value of genes by adopting hierarchical clustering method. The expression values of six individual are presented after being centered and scaled in the row direction. Each column represents a specimen and each row represents a gene. Red color indicates genes that were up-regulated and blue color indicates genes that were down-regulated.