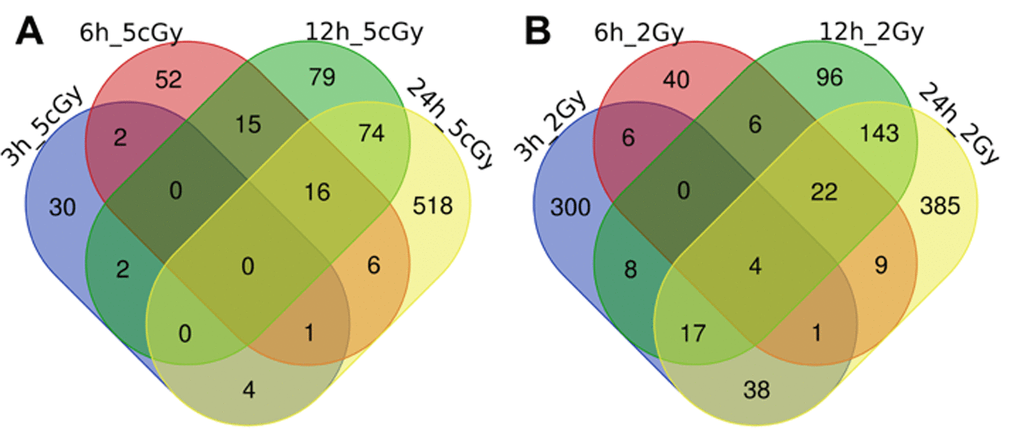
Figure 2.Venn diagrams, illustrating overlapping effects (down-regulated genes) of IR at different times of exposure: 3, 6, 12, 24 hours for the doses 5 cGy (A) and 2 Gy (B). Numbers indicate the amount of common/unique differentially expressed genes for the studied groups (Table S2).
Figure 2 — Replicative and radiation-induced aging: a comparison of gene expression profiles | Aging