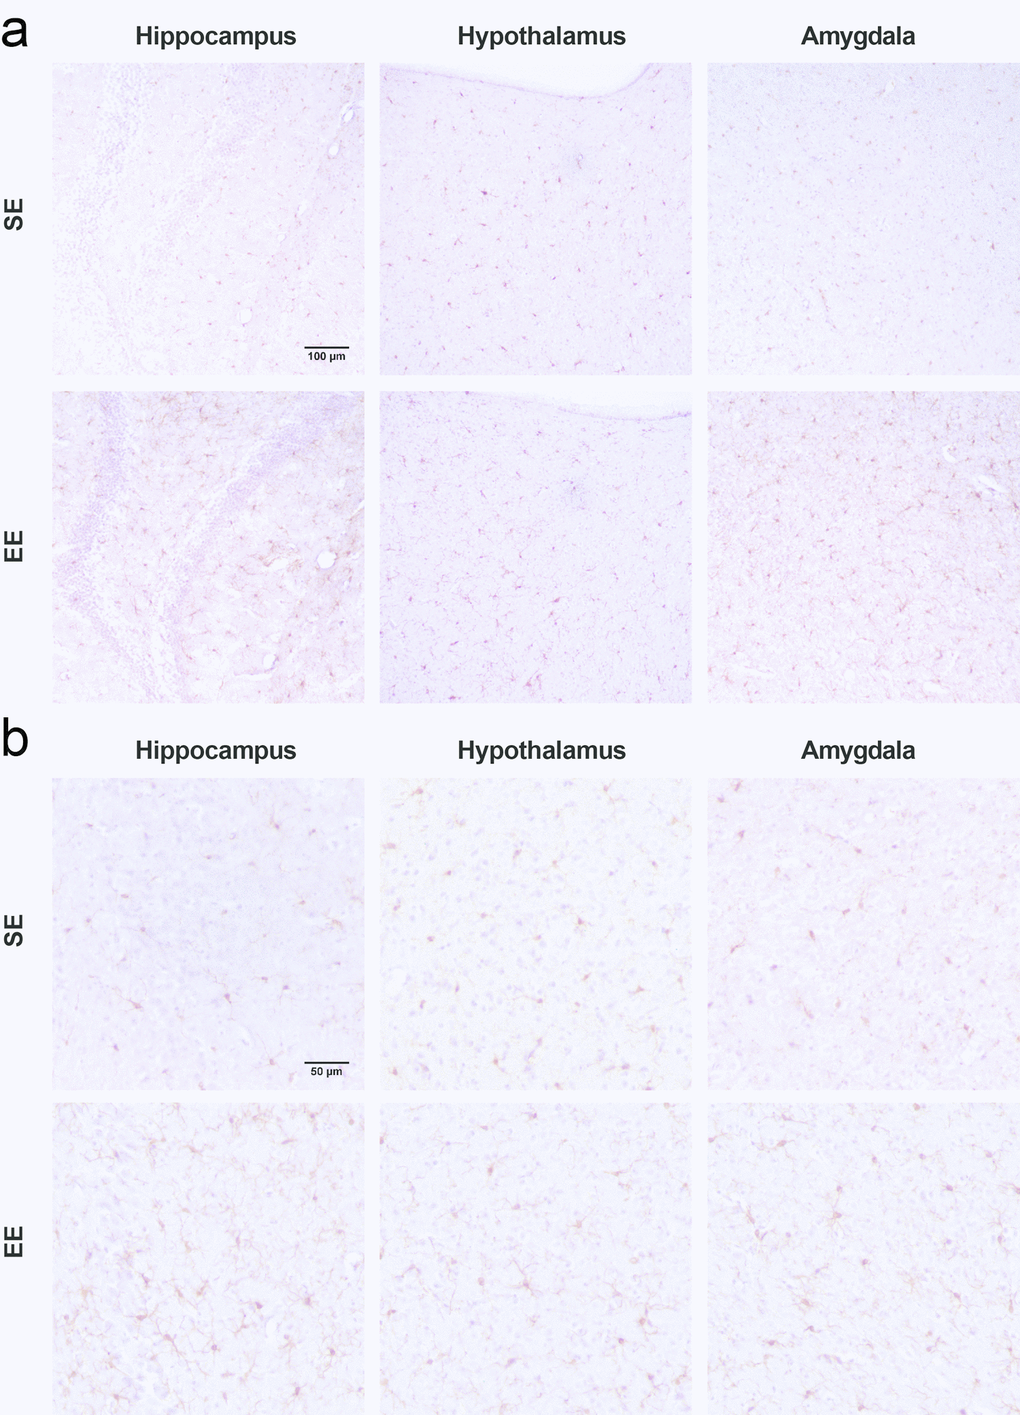
Figure 3.Microglial changes observed after 7.5-month EE. (a) Representative fields of Iba1 stained IHC in the hippocampus (left), hypothalamus (middle), and amygdala (right) at 20x magnification. (b) 40x magnification. Scalebars, (a) 100 µm and (b) 50 µm.