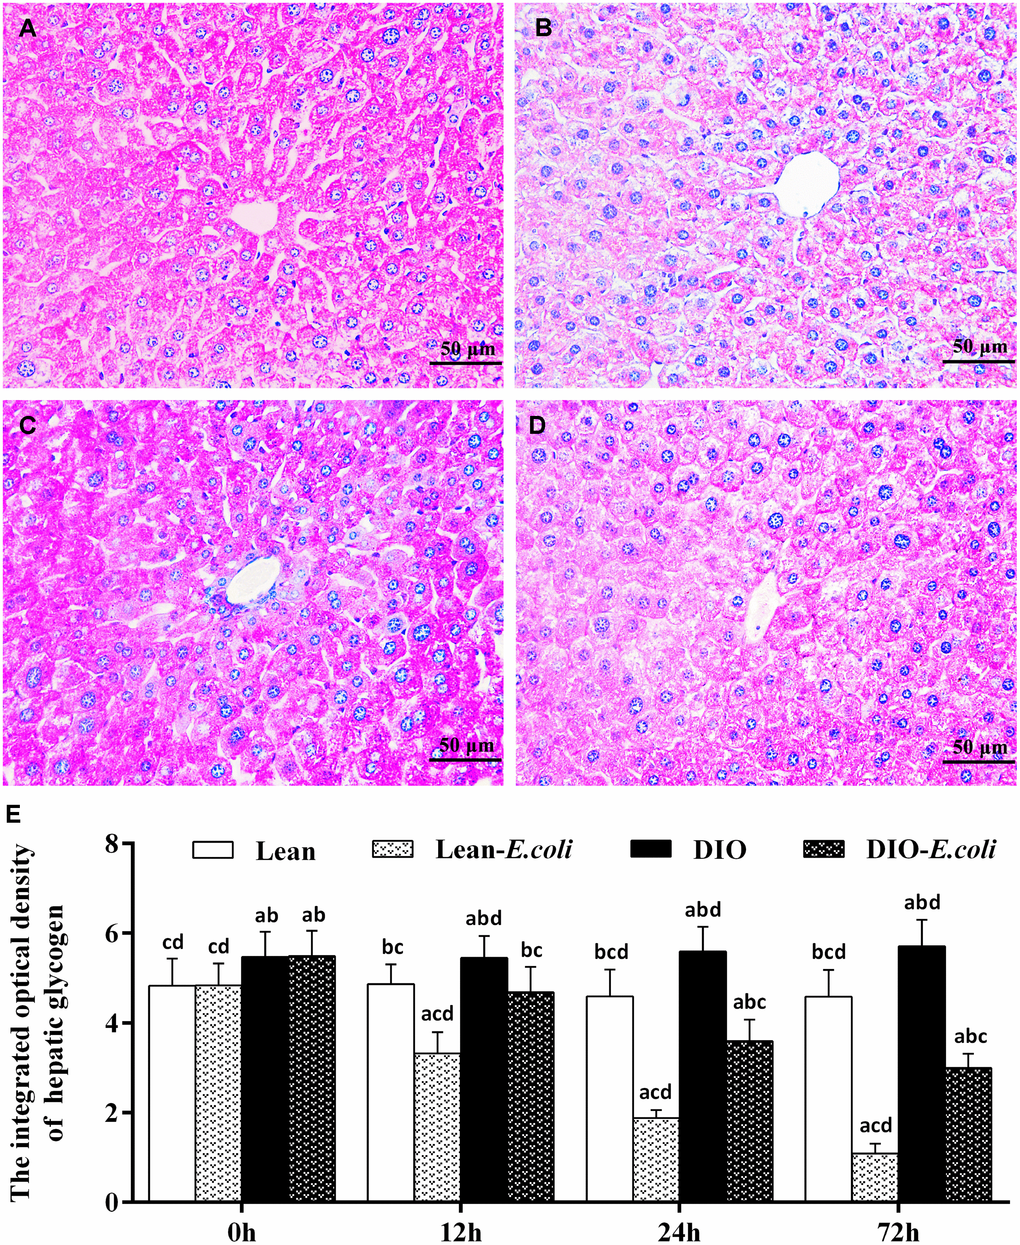
Figure 5.The changes of hepatic glycogen in the liver after E. coli infection. (A–D) The representative images of the hepatic glycogen deposition at 72h after receiving intranasal instillations (PAS staining, bar=50 μm). (A) lean group; (B) lean-E. coli group; (C) DIO group; (D) DIO-E. coli group; (E) The integrated optical density of hepatic glycogen. Note: Letter a, b, c or d represent difference (p<0.05) between the group and the lean group, lean-E. coli group, DIO group, or DIO-E. coli group, respectively.