


Introduction
Obesity, defined as a state of abnormal or excessive accumulation of adipose tissue due to imbalance in energy consumption and expenditure, increases the risk of various metabolic disease, such as type II diabetes, cardiovascular diseases and steatohepatitis [1]. According to the latest estimation from the World Health Organization, obesity has reached pandemic proportions, and worldwide obesity has nearly tripled since 1975, and more than 650 million adults were obese (body mass index (BMI) ≥ 30kg/m2) in 2016 [2]. With disordered metabolism of energy by excesses of adipose tissue, liver, as a center to maintain whole body energy homeostasis [3], is an affected target organ. Obesity plays an important role in the increasing prevalence of non-alcoholic fatty liver disease (NAFLD) [4] and hepatocellular carcinoma in humans [5]. And the obesity induced by high-fat diet is associated with hepatic steatosis and vesicular degeneration in mouse model [6, 7].
Obese individuals, apart from abnormal metabolism, exhibits altered immune state, which is characterized by abnormal production of inflammatory cytokines (e.g tumor necrosis factor (TNF)-α and interleukin (IL)-6 and adipocytokines (e.g resistin and leptin) [8]. And hospitalized obese patients have been shown to be at increased risk for pulmonary aspiration and community-related respiratory tract infections [9, 10]. Of bacteria causing community-acquired pneumonia, Escherichia coli (E. coli) is the second most common cause, and resulted in mortality of up to 70% reported by Packham and Sorrell [11]. Interestingly, the term “obesity paradox” was coined by Gruberg and colleagues who found that obese patients (BMI ≥ 30kg/m2) had lower risk for the in-hospital complications and one-year mortality rates after percutaneous coronary intervention compared with normal-weight (18.5 ≤ BMI ≤ 25 kg/m2) [12]. It has confirmed that “obesity paradox” might also be true in the population of obese patients with pneumonia. Nie and colleagues found that based on meta-analysis, obese subjects were significantly associated with reduced risk of pneumonia mortality [13]. The diet-induced obese (DIO) mice, similarly, exhibited less severe lung injury and lower mortality than the lean mice after intranasal instillations of non-fatal dose of E. coli, which was associated with the delayed inflammatory response and oxidative stress by diet-induced obesity [14, 15]. Furthermore, the infection-induced lipid metabolic disorders were slighter in the DIO mice than in the lean mice through AMPKα pathway in the state of non-fatal pneumonia caused by instillation E. coli [16].
It has been reported that community-acquired pneumonia could induce dysfunction of liver [17], and that lung microvascular permeability, neutrophilic alveolitis, and mortality were augmented if E. coli endotoxemia occurred with pre-existing acute liver injury [18], which indicated that liver plays a central role in the response to the E. coli-induced pneumonia. To investigate the hepatic histopathology and apoptosis in normal and DIO mice under E. coli-induced pneumonia, we performed the present study, in which the histopathology, cytokine and adipocytokine secretion, oxidative stress and apoptosis of liver in the DIO mice and lean mice with non-fatal pneumonia caused by E. coli were determined. The data from this research would provide a reference for the further study on the liver injury during bacterial pneumonia between the lean and DIO mice.
Results
The body weight, Lee's index and serum triglyceride (TG) and total cholesterol (TC) levels
The initial body weight of mice in the lean and DIO groups showed no significant difference (p>0.05). After feeding with the high-fat diets or normal diets for 8 weeks, the final body weight of mice in the DIO group was significantly increased (p<0.05) compared with the lean group (Figure 1A). Furthermore, the Lee's index and serum TG and TC levels in the DIO group were significantly higher (p<0.05) than those in the lean group (Figure 1B–1D).
Figure 1. The changes of body weight, Lee's index and serum TG and TC levels in mice. (A) Body weight; (B) Lee's index; (C) Serum TG; (D) Serum TC. Note: Letter a or b represents difference (p<0.05) between the group and lean group or DIO group, respectively.
Macroscopic parameters in the liver
Before pulmonary E. coli infection, the liver weight in the DIO group was higher (p<0.05) than that in the lean group, but the liver index showed no significance before infection (p>0.05). After E. coli infection, compared with the lean group, the liver weight and liver index in the lean-E. coli group were significantly increased (p<0.05) at 24 and 72h. And the liver weight and liver index in the DIO-E. coli group were raised (p<0.05) only at 72h in comparison to the DIO group. Moreover, at 24h and 72h post-infection, the liver indexes of the DIO-E. coli group were significantly lower (p<0.05) than those of the lean-E. coli group (Figure 2A and 2B).
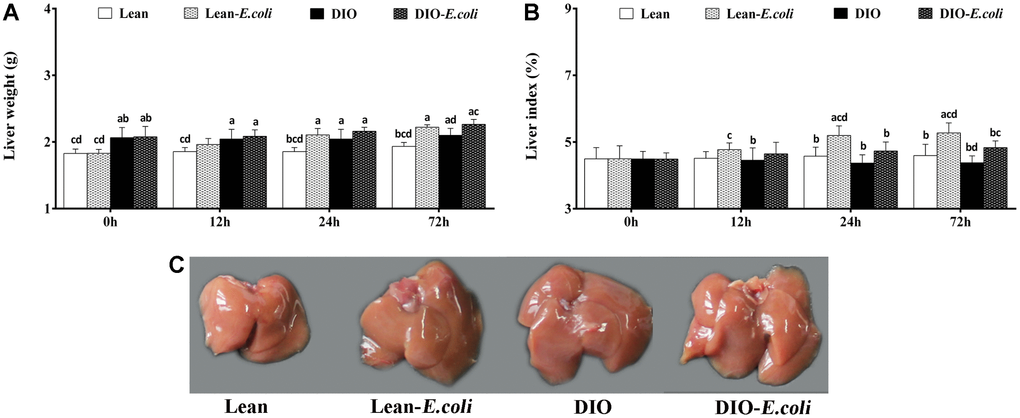
Figure 2. The changes of liver macroscopic parameters in mice after E. coli infection. (A) The liver weight; (B) The liver index; (C) The liver macroscopic structure at 72h. Note: Letter a, b, c or d represent difference (p<0.05) between the group and the lean group, lean-E. coli group, DIO group, or DIO-E. coli group, respectively.
Macroscopically, before infected with E. coli, lean and DIO mice showed similar hepatic morphological characteristics including color and texture, except that DIO mice exhibited larger hepatic volume than the lean mice. After infected with E. coli, liver volumes of the lean- and DIO-E. coli mice were larger than those of lean and DIO mice, respectively, especially at 72 h (Figure 2C). This was coincidence with the liver weight showed in Figure 2A.
Histopathological observation of liver
Microscopically, in Figure 3A, the histopathological structure of the liver in the lean group was normal with orderly arranged-hepatic cords and obvious hepatic sinusoids, as well as normal hepatocytes. And the histological structure of hepatic tissue in the DIO group was similar to that in the lean group, except for massive fatty droplets in the hepatocytes. After E. coli infection at 12h, the hepatic cords were disorganized, and hepatic sinusoids appeared narrow due to the swelling of hepatocytes, and liver steatosis and vesicular degeneration were observed in both the lean- and DIO-E. coli groups. Albeit the DIO-E. coli group exhibited more serious steatosis and vesicular degeneration than the lean-E. coli group from 0h to 72h, the lean-E. coli group changed more dramatically. All the pathological changes mentioned above aggravated from 24h to 72h post-infection. As indicated in Table 1, the histological score showed the difference in the severity of steatosis and vesicular degeneration among four groups after infection.
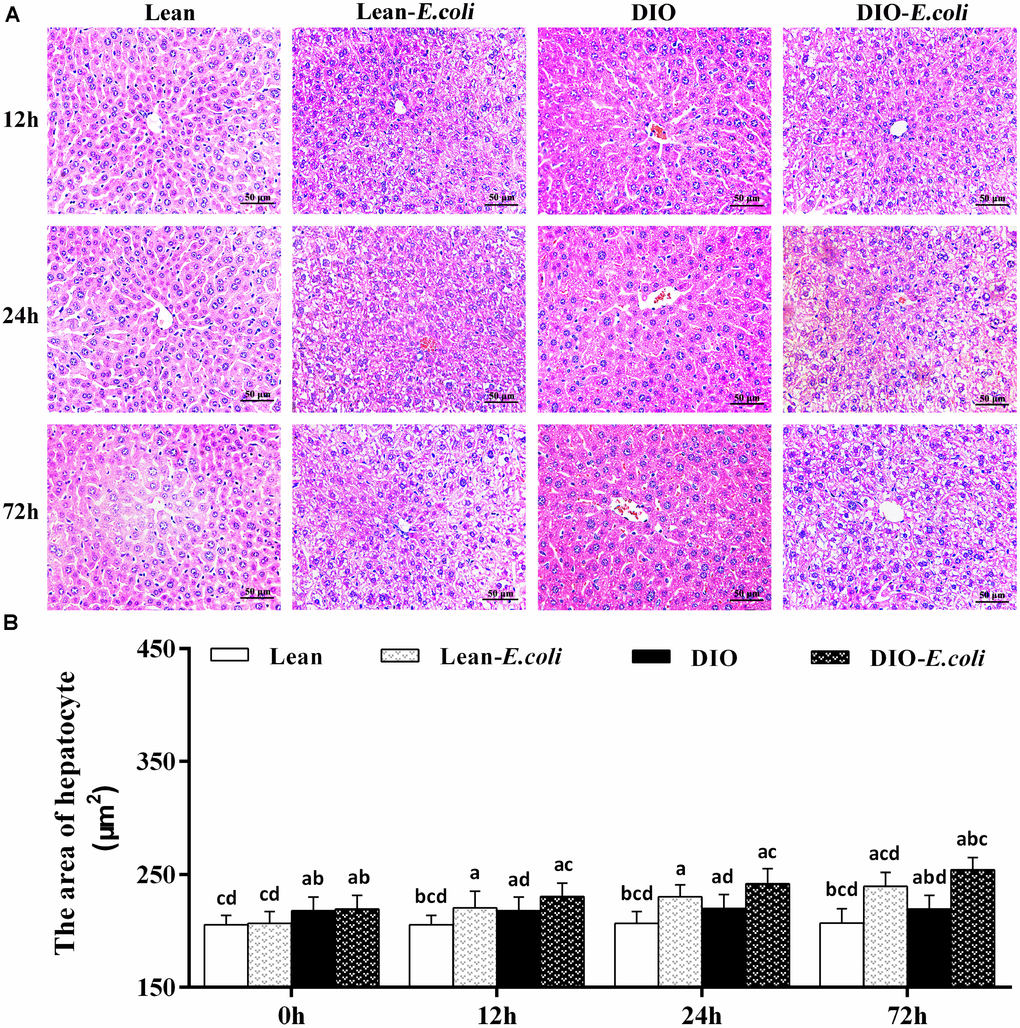
Figure 3. The histopathological changes of the liver after E. coli infection. (A) The representative histopathological images of livers (HE staining, bar=50 μm); (B) The area of hepatocyte. Note: Letter a, b, c or d represent difference (p<0.05) between the group and the lean group, lean-E. coli group, DIO group, or DIO-E. coli group, respectively.
Table 1. Histological score of hepatic steatosis and vesicular degeneration.
| Lean group | Lean-E. coli group | DIO group | DIO-E. coli group | ||||||||||||||||||||||||||||||||||||||||||||||||||||||||||||||||||||||||||||||||||||||||||||||||
| 0h | 0 | 0 | 2 | 2 | |||||||||||||||||||||||||||||||||||||||||||||||||||||||||||||||||||||||||||||||||||||||||||||||
| 12h | 0 | 3 | 2 | 4 | |||||||||||||||||||||||||||||||||||||||||||||||||||||||||||||||||||||||||||||||||||||||||||||||
| 24h | 0 | 4 | 2 | 5 | |||||||||||||||||||||||||||||||||||||||||||||||||||||||||||||||||||||||||||||||||||||||||||||||
| 72h | 0 | 5 | 2 | 6 | |||||||||||||||||||||||||||||||||||||||||||||||||||||||||||||||||||||||||||||||||||||||||||||||
| Note: The level of severity was judged from 0 to 6, and the larger the number is, the more serious lesion is. | |||||||||||||||||||||||||||||||||||||||||||||||||||||||||||||||||||||||||||||||||||||||||||||||||||
The area of hepatocyte in the DIO group was larger (p<0.05) than that in the lean group before infection. After infection, the area of hepatocyte significantly increased (p<0.05) in the lean-E. coli group or DIO-E. coli group from 12h to 72h compared with the lean group or DIO group, respectively, but it was significantly higher in the DIO-E. coli group than in the lean-E. coli group at 72h (p<0.05) (Figure 3B).
The integrated optical density of lipid droplets in the liver
The integrated optical density of lipid droplets was used to evaluate the sum of all lipid droplets in the entire field of view under microscope (Figure 4). Before infection, the integrated optical density was very low in the lean group; but this value was significantly higher in the DIO mice than in the lean mice (p<0.05). After E. coli infection, from 12h to 72h, the values were significantly elevated (p<0.05) in the lean- and DIO-E. coli groups in comparison to the lean and DIO groups, respectively. Furthermore, the value in the DIO-E. coli group was significantly higher (p<0.05) than that in the lean-E. coli group from 12h to 72h post-infection, but the increased ratio was higher in the lean-E. coli group.
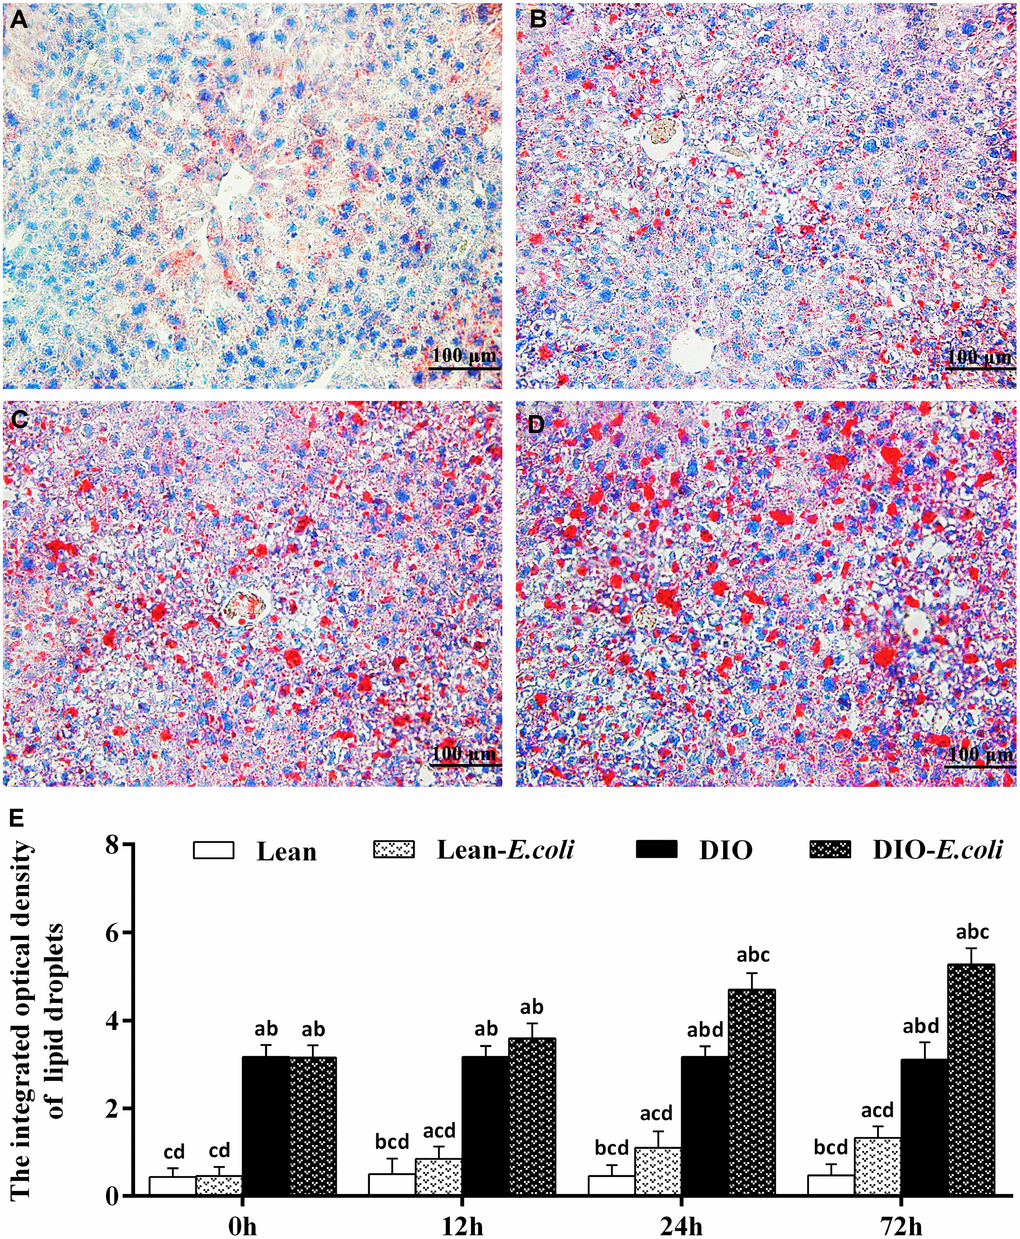
Figure 4. The changes of lipid droplet deposition in the liver after E. coli infection. (A–D) The representative images of the liver lipid droplets deposition at 72h after receiving intranasal instillations (Oil Red O staining, bar=100 μm). (A) lean group; (B) lean-E. coli group; (C) DIO group; (D) DIO-E. coli group; (E) the integrated optical density of hepatic lipid droplets. Note: Letter a, b, c or d represent difference (p<0.05) between the group and the lean group, lean-E. coli group, DIO group, or DIO-E. coli group, respectively.
The integrated optical density of hepatic glycogen
Also, the integrated optical density of glycogen was used to evaluate the sum of glycogen in the entire field of view under microscope (Figure 5). Before infection, the integrated optical density of hepatic glycogen was high both in the lean and DIO groups, and the DIO mice had higher values (p<0.05) than the lean mice. After infection, the values decreased (p<0.05) both in the lean-E. coli group and DIO-E. coli group from 12h to 72h, respectively. And the values in the DIO-E. coli group were higher (p<0.05) than those in the lean-E. coli group from 12h to 72h.
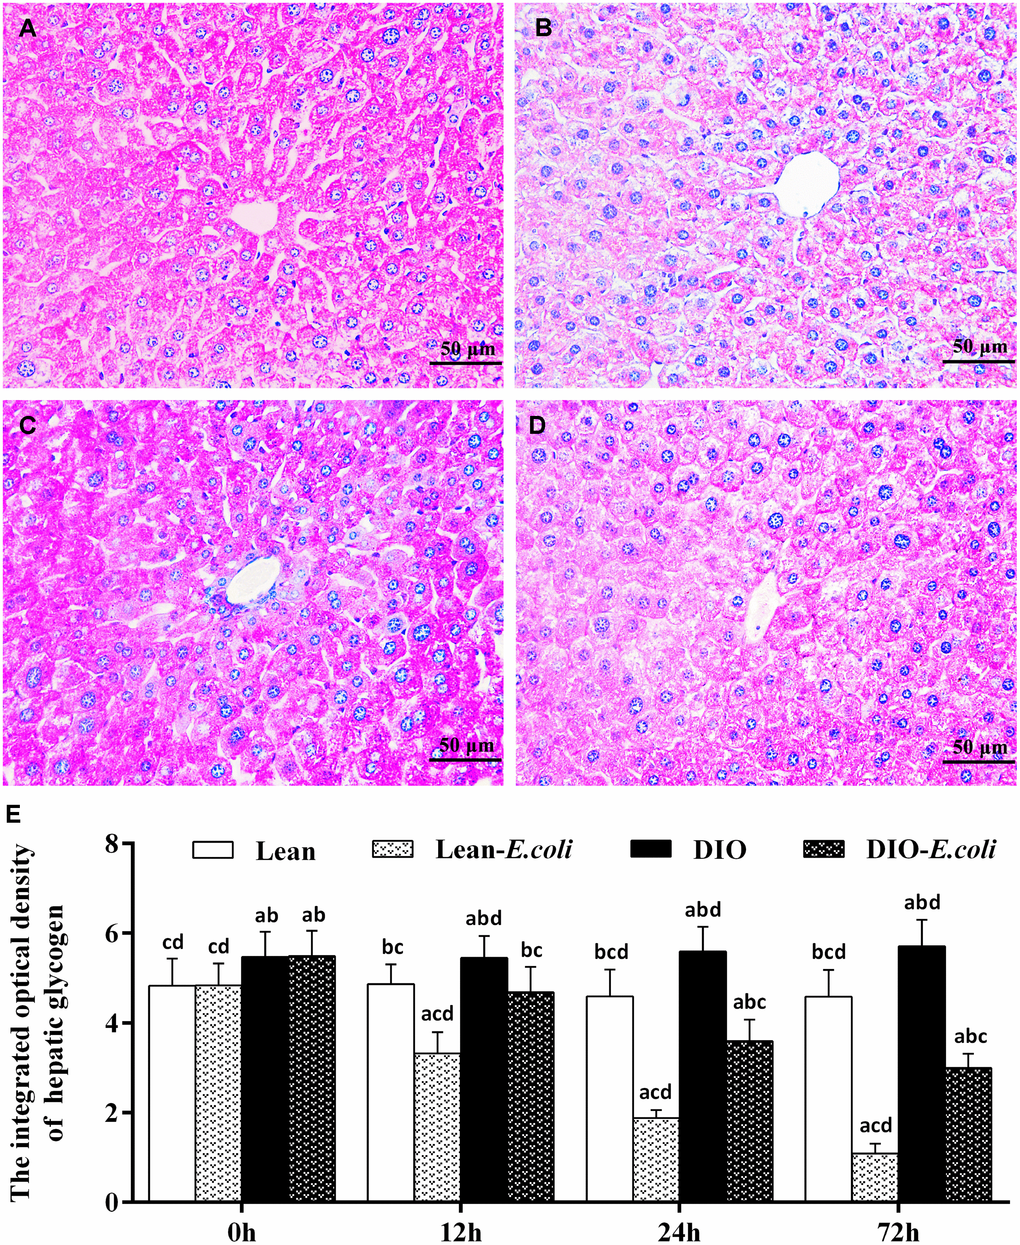
Figure 5. The changes of hepatic glycogen in the liver after E. coli infection. (A–D) The representative images of the hepatic glycogen deposition at 72h after receiving intranasal instillations (PAS staining, bar=50 μm). (A) lean group; (B) lean-E. coli group; (C) DIO group; (D) DIO-E. coli group; (E) The integrated optical density of hepatic glycogen. Note: Letter a, b, c or d represent difference (p<0.05) between the group and the lean group, lean-E. coli group, DIO group, or DIO-E. coli group, respectively.
The hepatic apoptosis
As shown in Figure 6A, cells in the cycle were the objective cells, which means the liver cells including parenchyma cells (hepatocytes) and nonparenchymal cells (like hepatic stellate cell, endotheliocyte and Kupffer's cells). Before being treated with E. coli, the percentages of liver apoptotic cells showed no significant difference (p>0.05) between the lean group and the DIO group. After being infected with E. coli, the values in the lean-E. coli group or DIO-E. coli group were significantly increased (p<0.05) compared with the lean group or DIO group from 12h to 72h, respectively. Moreover, the values in the DIO-E. coli group were significantly lower (p<0.05) than those in the lean-E. coli group at 24h and 72h (Figure 6B).
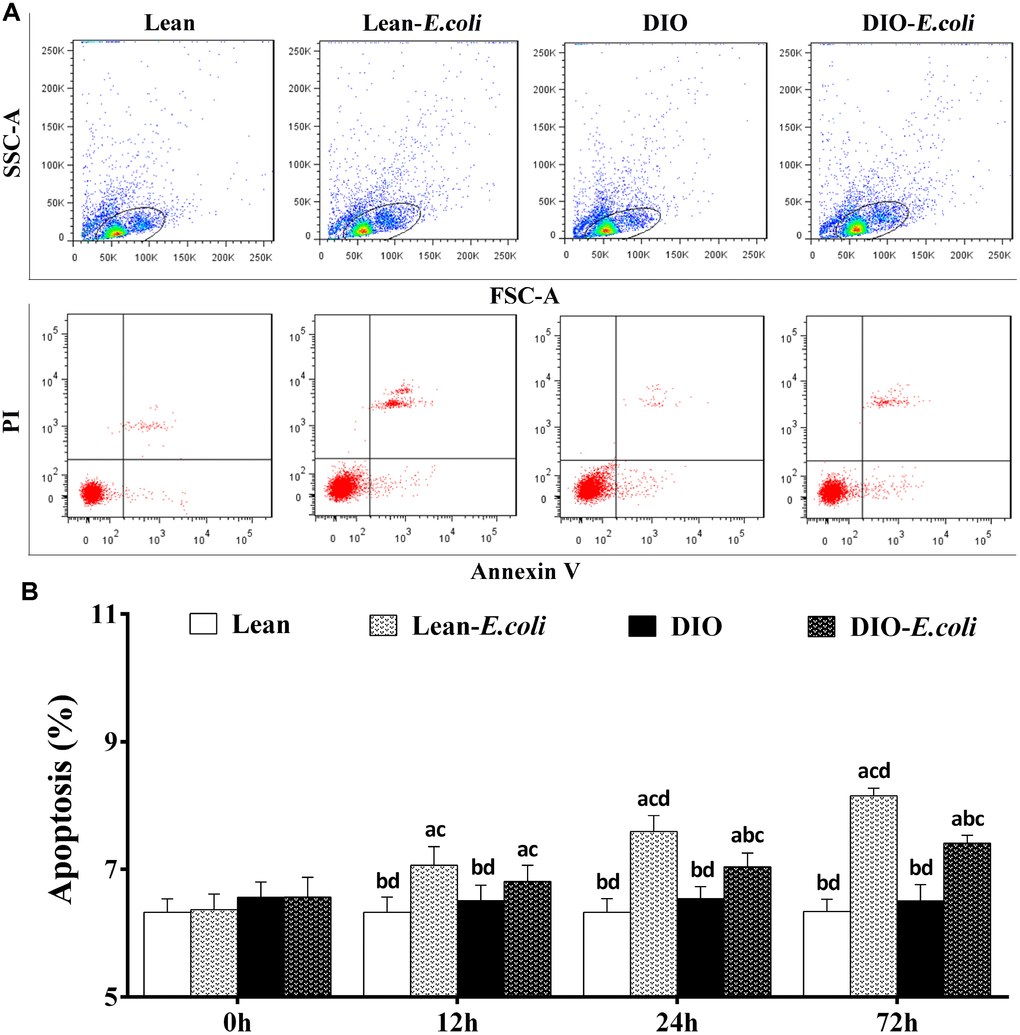
Figure 6. The percentages of hepatic apoptosis after E. coli infection. (A) The representative scatter gram of hepatic apoptosis at 72h after receiving intranasal instillations. (B) Hepatic apoptosis percentages. Note: Letter a, b, c or d represent difference (p<0.05) between the group and the lean group, lean-E. coli group, DIO group, or DIO-E. coli group, respectively.
The contents of the hepatic cytokines and adipocytokines
Before infection with E. coli, TNF-α, IL-6, resistin, and leptin contents of the DIO group were significantly higher (p<0.05) than those of the lean group. After infection, when compared with the lean group, the contents of TNF-α, IL-1β, IL-6, IL-8, resistin, and leptin in the lean-E. coli group were significantly raised (p<0.05) from 12h to 72h, except for IL-1β, IL-8, and leptin at 12h. The contents of TNF-α, IL-1β, IL-6, IL-8, and resistin in the DIO-E. coli group were dramatically increased (p<0.05) at 24h and 72h in comparison to the DIO group, while leptin only at 72h. And the contents of TNF-α, IL-6 and resistin in the DIO-E. coli group significantly decreased (p<0.05) in comparison to the lean-E. coli group at 72h, while the IL-8 increased at 24h (Figure 7).
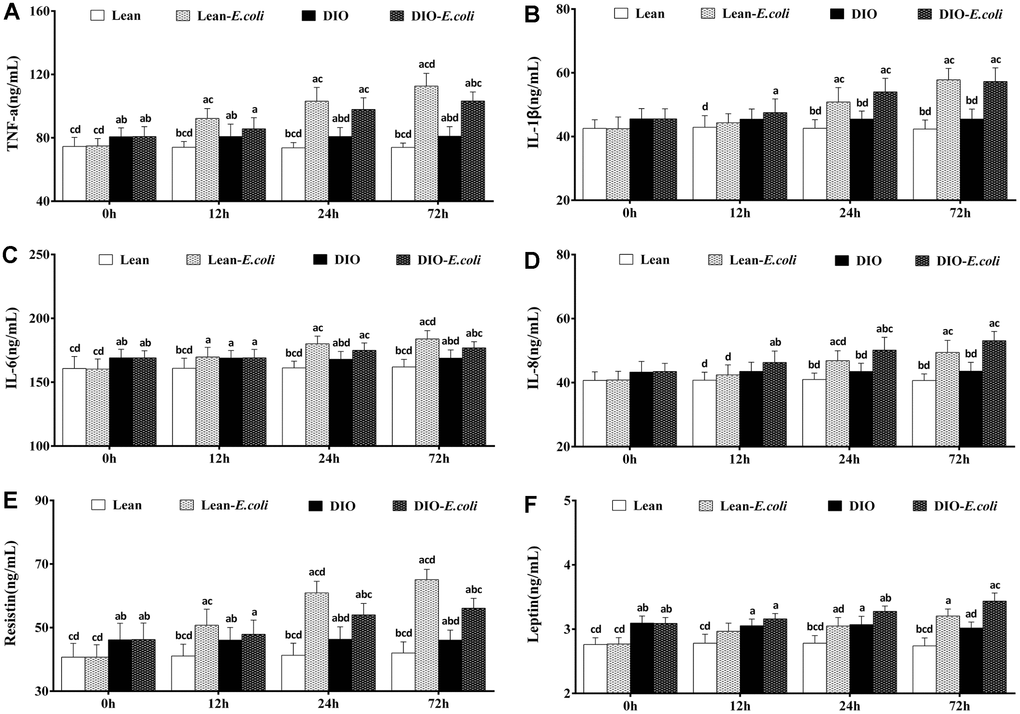
Figure 7. The contents of cytokines and adipocytokines in the liver after E. coli infection. (A) TNF-α; (B) IL-1β; (C) IL-6; (D) IL-8; (E) Resistin; (F) Leptin. Note: Letter a, b, c or d represent difference (p<0.05) between the group and the lean group, lean-E. coli group, DIO group, or DIO-E. coli group, respectively.
The oxidative stress in the liver
As indicated in Figure 8, before infected with E. coli, the DIO mice had significantly higher (p<0.05) contents of MDA and activity of GSH-Px than the lean mice. From 12h to 72h post-infection, compared with the lean group, the contents of MDA and GSH, and the activities of GSH-Px, CAT and SOD significantly raised (p<0.05) in the lean-E. coli group, except for SOD at 12h. Meanwhile, the contents of MDA, and GSH and the activities of GSH-Px, CAT, and SOD in the DIO-E. coli group significantly elevated (p<0.05) at 24h and 72h in comparison to the DIO group. Moreover, compared with the lean-E. coli group, the contents of MDA and GSH, and the activity of CAT significantly decreased (p<0.05) in the DIO-E. coli group at 24h and 72h.
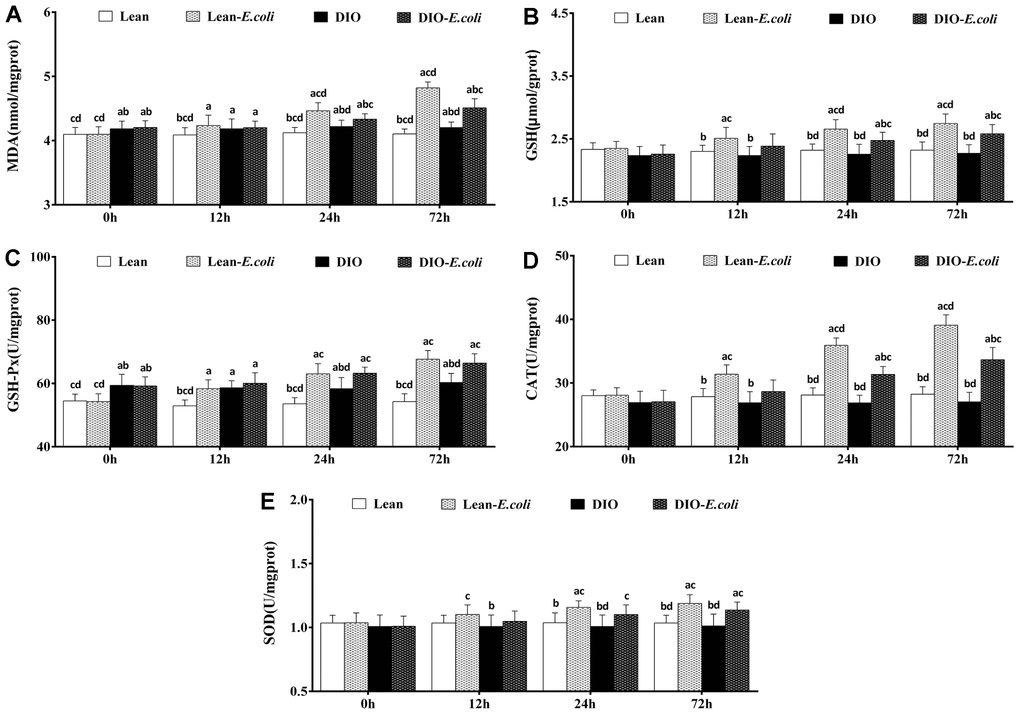
Figure 8. The changes of oxidative stress in the liver after E. coli infection. (A) MDA; (B) GSH; (C) GSH-Px; (D) CAT; (E) SOD. Note: Letter a, b, c or d represent difference (p<0.05) between the group and the lean group, lean-E. coli group, DIO group, or DIO-E. coli group, respectively.
The expression levels of apoptotic regulatory mRNAs in the liver
The Caspase-3 mRNA and Bax/Bcl-2 mRNA ratio of the DIO group were significantly higher (p<0.05) than those of the lean group before infection. From 12h to 72h post-infection, compared with the lean group or the DIO group, the expression levels of Caspase-3, Caspase-9 and Bax mRNA, and Bax/Bcl-2 mRNA ratio in the lean-E. coli group or the DIO-E. coli group significantly raised (p<0.05), while Bcl-2 mRNA significantly decreased (p<0.05) in the lean-E. coli group (12h to 72h) or the DIO-E. coli group (24h and 72h), respectively. Besides, the DIO-E. coli group exhibited significantly lower (p<0.05) levels of Caspase-3, Caspase-9 and Bax mRNA, and Bax/Bcl-2 mRNA ratio than the lean-E. coli group from 12h to 72h, but higher levels of Bcl-2 mRNA at 24h and 72h (Figure 9).
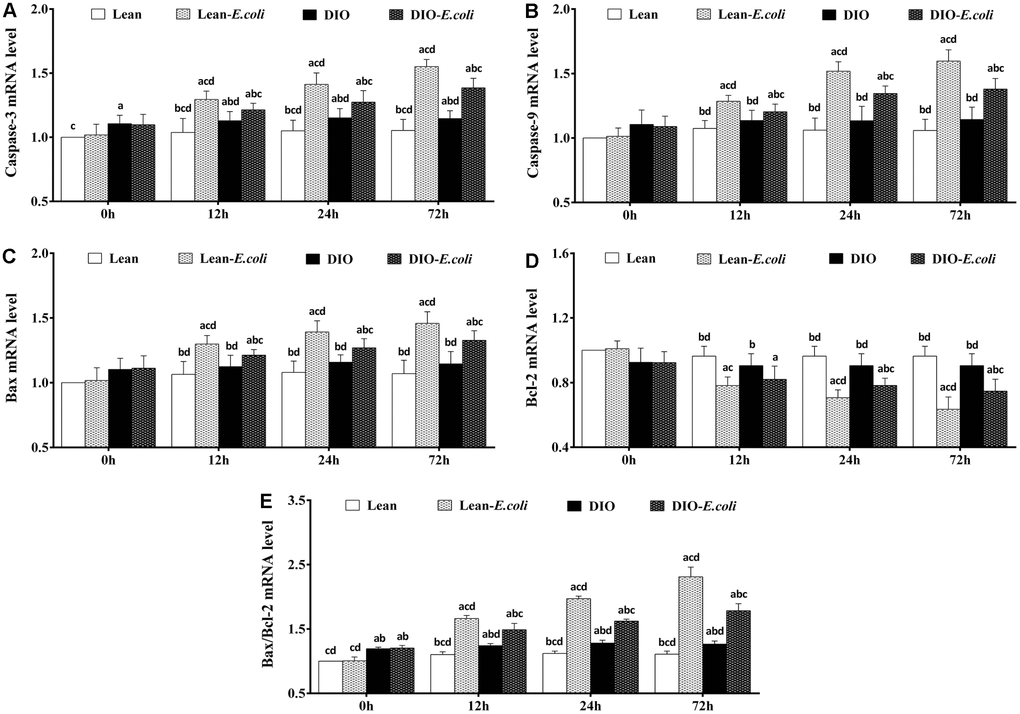
Figure 9. The changes of mRNA expression levels in the liver (expressed as fold change relative to the lean group) after E. coli infection. (A) Caspase-3 ; (B) Caspase-9; (C) Bax; (D) Bcl-2; (E) Bax/Bcl-2. Note: Letter a, b, c or d represent difference (p<0.05) between the group and the lean group, lean-E. coli group, DIO group, or DIO-E. coli group, respectively.
The levels of apoptotic regulatory proteins in the liver
The protein expression levels of Caspase-3 and Bax, and Bax/Bcl-2 protein ratio in the DIO group were higher (p<0.05) than those in the lean group before infection. From 12h to 72h post-infection, the levels of Caspase-3, Caspase-9 and Bax proteins, and Bax/Bcl-2 protein ratio in the lean-E. coli group were significantly increased (p<0.05), compared with the lean group, while Bcl-2 was significantly decreased (p<0.05). Interestingly, Caspase-3, Caspase-9, and Bax proteins in the DIO-E. coli group were significantly raised (p<0.05) only at 72h, whereas Bcl-2 was decreased (p<0.05) only at 72h in comparison to the DIO group. And higher (p<0.05) Bax/Bcl-2 protein ratio was observed in the DIO-E. coli group compared with the DIO group from 12h to 72h. Compared with the lean-E. coli group, moreover, the DIO-E. coli group showed significantly decreased (p<0.05) levels of Caspase-3, Caspase-9, Bax proteins and Bax/Bcl-2 protein ratio at 24h and 72h, while increased levels of Bcl-2 (Figure 10).
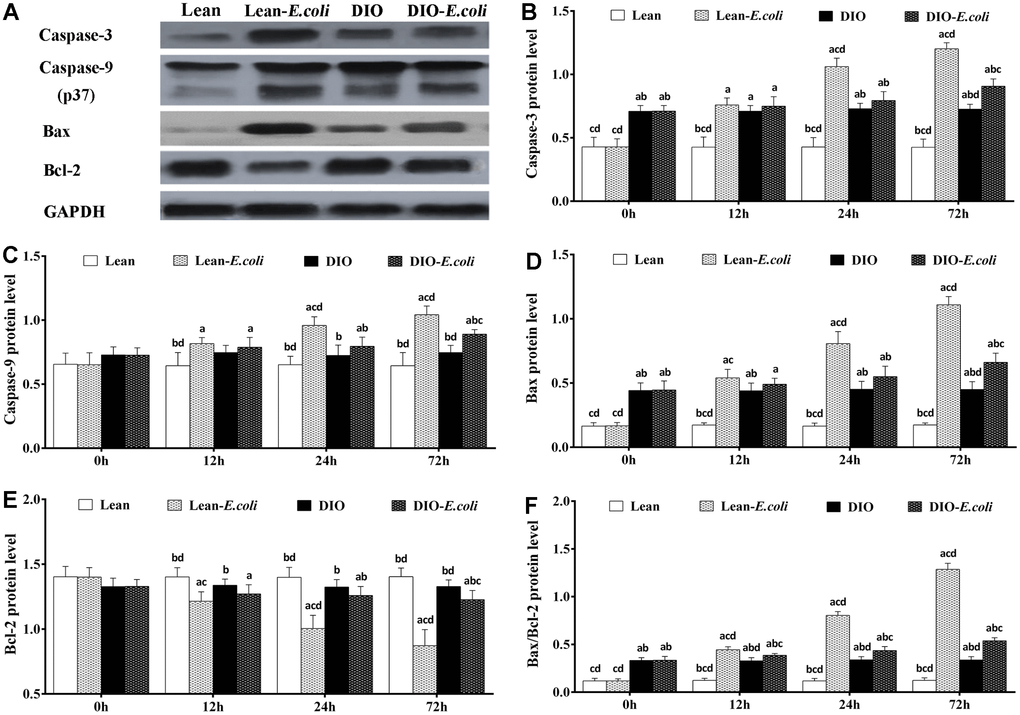
Figure 10. The changes of protein levels in the mice liver after E. coli infection. (A) The representative image of apoptotic regulatory proteins at 72h after receiving intranasal instillations. (B–F) Quantitative analysis of the relative protein expression (expressed as fold change relative to the lean group). Note: Letter a, b, c or d represent difference (p<0.05) between the group and the lean group, lean-E. coli group, DIO group, or DIO-E. coli group, respectively.
Discussion
Globally, due to not only obesity per se, but obesity-related complications (like type II diabetes, cardiovascular disease and cancer) [19], obesity constitutes a serious threaten to the current and future health of all populations. Recently, Corrales-Medina and colleagues found that obesity may exert a protective effect against 30-day mortality from community-acquired bacterial pneumonia [20]. Our previous studies showed that compared with the lean mice, the diet-induced obese (DIO) mice exhibited lower neutrophil infiltration and contents of proinflammatory cytokines and oxidative stress, and less severe histopathological lesions in the lung, as well as slighter lipid metabolic disorders in the liver after intranasal instillations of non-fatal dose of E. coli [14–16]. Moreover, a report has shown that community-acquired pneumonia could induce dysfunction of liver [17]. As known, obese patients have altered physiological metabolism and immune responses. Therefore, in this research, we focused on the liver to investigate the hepatic histopathology and apoptosis in the DIO Mice after E. coli-induced pneumonia.
The mice receiving high-fat diet exhibited higher body weight, Lee's index, levels of triglyceride (TG) and total cholesterol (TC) than those receiving normal diet, indicating that the DIO mouse model was established as previously described by Wan et al. [14]. Both the lean and DIO mice showed increased liver weight and liver indexes during the E. coli pneumonia, consistent with the larger hepatic volume by macroscopic observation. By paraffin sections and several stains, moreover, the histological structures of liver were obviously influenced by high-fat diet and/or E. coli infection. Compared with the lean mice, before E. coli infection, the hepatic steatosis and vesicular degeneration were observed in the DIO mice, which may result from the increased level of serum TG. Study in animal models of NAFLD demonstrated that inhibition of TG synthesis resulted in improvement in hepatic steatosis [21]. During the E. coli infection, notwithstanding both the lean-E. coli and DIO-E. coli groups showed hepatic steatosis and vesicular degeneration, such changes in the lean-E. coli group were more dramatic than those in the DIO-E. coli group, which may contribute to the higher liver index in the lean-E. coli group in comparison to the DIO-E. coli group after infection. It indicated that the histological structures of liver more drastically worsened in the lean-E. coli group caused by E. coli infection than by the DIO-E. coli group. In addition, high-fat diet increased the reserves of hepatic glycogen, while E. coli infection induced the mobilization of liver glycogen in both the lean-E. coli group and DIO-E. coli group, of which the lean-E. coli group was more. Glycogen, as one of two forms of long-term energy reserves, can be synthesized by several enzymes, like glycogen synthase, when the blood glucose rises, otherwise it is decomposed. Jones et al. found that glycogen stores might be consumed by colonized E. coli as the source of carbon and energy [22]. In the present study, we found that the reduction of hepatic glycogen in the lean-E. coli group was more than that in the DIO-E. coli group, which may support the long-term survival of E. coliin vivo and contribute to the larger E. coli loads in the lung of lean mice with E. coli pneumonia reported by our previous study [14]. These results indicated that the liver could be not only impacted by E. coli pneumonia, but involved in the anti-bacteria of host.
Increase of hepatocyte apoptosis is typically present in patients with NAFLD and in experimental models of steatohepatitis [23]. With hepatic lipid dysregulation caused by E. coli pneumonia in the present study, we hypothesized, therefore, that E. coli infection caused hepatic apoptosis and impacted differently to the lean- and DIO-E. coli groups. Through flow cytometry method, high-fat diet caused increased trend on the hepatic apoptosis in the mice, and E. coli infection increased hepatic apoptosis both in the lean- and DIO-E. coli groups, in which the lean-E. coli group exhibited higher apoptotic percentage of liver than the DIO-E. coli group. Apoptosis is a form of programmed cell death that occurs in multicellular organisms, and excessive apoptosis causes atrophy and impairment of organs. Liu et al. revealed that the massive apoptosis of hepatocytes indicated an important step in the development of acute liver injury induced by lipopolysaccharide (LPS) [24]. The data demonstrated that, during the E. coli-caused pneumonia, hepatic impairment induced by excessed apoptosis may be more severe in the lean-E. coli group than in the DIO-E. coli group.
The initiation of apoptosis is tightly regulated by activation mechanisms, and inflammatory mediators and oxidative stress have been confirmed to involved in the process of apoptosis [25]. The hepatic apoptosis is accelerated by several inflammatory mediators, like TNF-α [24]. Conversely, it is inhibited by inflammatory cytokines, such as IL-1β [26], IL-6 [27, 28] and IL-8 [29]. Fukunishi et al. demonstrated that LPS, derived from E. coli, can accelerate inflammation via hepatic production of pro-inflammatory cytokines such as TNF-α, and IL-6 [30]. During E. coli pneumonia, E. coli-derived LPS may reach the liver from the lung by circulation and induce the production of inflammatory cytokines. Moreover, certain adipocytokines, including leptin and resistin, have been reported to act as proinflammatory cytokines [31, 32] and be potential to regulate the process of apoptosis. The leptin exerted anti-apoptotic effect on hepatocytes during acute liver injury in rats [33], as well as resistin [34]. In the present study, the high-fat diet increased the levels of TNF-α, IL-6, resistin and leptin, demonstrating that the pro-apoptotic and anti-apoptotic properties were enhanced. Compared with the DIO-E. coli group, the TNF-α contents of the lean-E. coli group were increased, which may explain the elevated apoptotic percentage of the liver. However, among other cytokines and adipocytokines exerting anti-apoptosis, the levels of IL-8 and leptin in the DIO-E. coli group were higher than those in the lean-E. coli group, while the changes of IL-6 and resistin in the DIO-E. coli group were lower, which may be associated with the contents of TC. Amundson et al. revealed that obese individuals with high serum TC levels can neutralize circulating LPS, thus decreasing inflammation and inflammatory cytokines [35]. Thereafter, the cytokines or adipocytokines associated with the process of apoptosis could partially explain the increased apoptotic percentage in the liver of the lean-E. coli group in comparison to the DIO-E. coli group.
Oxidative stress, an imbalance between in vivo oxidative and anti-oxidative effects, was estimated by the contents of MDA and GSH, and the activities of GSH-Px, CAT and SOD. MDA is a marker for oxidative stress and the end product of lipid oxidation [36]. GSH is an important antioxidant, which is capable of preventing damage from reactive oxygen species (ROS) under the catalysis of GSH-Px [37]. SOD and CAT, as antioxidases, play critical roles in the elimination of ROS [38]. As is known, obesity is connected with an increase in oxidative stress and formation of ROS [39]. Thus, before E. coli infection, the DIO mice exhibited higher MDA content and GSH-Px activity than the lean mice, in line with previous study [40]. Following E. coli infection, the contents of MDA and GSH, and the activities of GSH-Px, CAT and SOD significantly increased in the liver of both the lean- and DIO-E. coli groups, which demonstrated that E. coli infection caused hepatic oxidative stress. The source of the oxidative stress in the liver may result from the inflammation in the lung. It has been confirmed that the phagocytosis of gram-negative bacteria (e.g., E. coli) can activate the primary host defense mechanism and result in the generation and release of ROS [41]. The other source may be the LPS produced by E. coli, because LPS could increase lipid peroxidation, an index of oxidative stress [42]. After E. coli infection, moreover, the contents of MDA, and the activities of GSH and CAT were markedly higher in the lean-E. coli group than in the DIO-E. coli group. According to the results above, E. coli pneumonia caused oxidative stress in the liver of lean- and DIO-E. coli groups, and it was more serious in the lean mice.
Oxidative stress is tightly related to the apoptosis. It is well established that mitochondria is the main site of the generation of ROS [26], and, by formation of membrane pores or increasing permeability of the membrane, oxidative stress impairs mitochondria and causes apoptotic effectors to leak out [43], in which the Bcl-2 and Bax are indispensable. Bax permeabilizes the outer membrane of mitochondria rendering apoptotic cascade, which could be counteracted by Bcl-2 [44], and the Bax/Bcl-2 ratio is in positive correlation with apoptosis [45]. Once apoptotic effectors (e.g. cytochrome c) are released from the mitochondria, the apoptosome is therefore formed in the cytoplasm, and actives Caspase-9, which in turn activates Caspase-3. In the present study, through qRT-PCR and Western blot, high-fat diet increased the levels of Caspase-3 mRNA and protein, and Bax/Bcl-2 ratio in the liver, indicating that the hepatic apoptosis was initiated. However, the apoptotic percentage in the liver of the DIO mice was not significantly higher than that of the lean mice, which may result from the anti-apoptotic capacities of the cytokines and adipocytokines, such as IL-6 and resistin. During E. coli pneumonia, the mRNA and protein expression levels of Bax, Caspase-9 and Caspase-3, and Bax/Bcl-2 ratio were all elevated in the liver of both the lean- and DIO-E. coli groups, while the Bcl-2 was reduced. Compared with the lean-E. coli group, the levels of Bax, Caspase-9 and Caspase-3, and Bax/Bcl-2 ratio in the DIO-E. coli group decreased, while Bcl-2 increased, consistent with the increase of hepatic oxidative stress. It was supported that, during E. coli pneumonia, the oxidative stress induced the apoptosis in the liver, and the liver of lean mice was more sensitive to the E. coli pneumonia than that of DIO mice in this aspect.
In conclusion, E. coli-induced pneumonia caused liver damages, such as hepatic steatosis, vesicular degeneration, oxidative stress, increased hepatic apoptosis and higher levels of cytokines and adipocytokines. However, such damages showed less severely in the DIO mice than in the lean mice following E. coli pneumonia.
Materials and Methods
All experimental animals, methods and procedures were approved by the institute of Animal Care and the Ethics Committee of Sichuan Agricultural University (Approval No: 2012-024, Chengdu, China).
Mouse model of diet-induced obesity
128 male 21-day-old ICR mice were housed under specific-pathogen-free raising condition. Based on a previous description [14, 15], after feeding with normal diets or high-fat diets for 8 weeks, all mice were weighed, and their lengths were measured. Mice with obese index greater than 20% and significantly high Lee's index, serum triglyceride (TG) and total cholesterol (TC) contents (A110-1 and A111-1, Nanjing Jiancheng Bioengineering Institute, China) were regarded as obese animals. Then, the mice were divided into two groups (64/group) as lean (normal diet) and DIO (high-fat diet) groups, respectively. Both the mice and normal or high-fat diets were purchased from Dossy Animal Center (Chengdu, China).
Escherichia coli (E. coli) induced non-fatal pneumonia model
E. coli strains were stored in the Veterinary Medical Laboratory of Sichuan Agricultural University. The E. coli-induced non-fatal pneumonia model had been established according to previous reports [14, 15]. Then, the lean and DIO mice were subdivided into four groups (32/group) after being intranasally instilled with 40μL PBS or 4×10⁹CFUs/mL E. coli, namely, lean, DIO, lean-E. coli, and DIO-E. coli groups. Mice were sacrificed at 0h (pre-infection), and 12h, 24h, and 72h (post-infection), and then, serum samples and liver tissues from 8 mice in each group were obtained to perform the following assays.
Measurement of liver weight and liver index
After necropsy, whole livers were removed aseptically from individual animals, weighed, and photographed. Liver index was calculated by the following formula:
Histopathological examination
The liver tissues were observed and then immediately fixed in 4% paraformaldehyde overnight. Subsequently, the tissues were dehydrated through graded alcohol, paraffin embedded, sectioned at 5μm, and processed for H.E. staining and Periodic Acid-Schiff (PAS) for glycogen. Analysis of intracellular lipid droplets was determined using Oil Red O staining kits (Nanjing Jiancheng Bioengineering Institute, China). The liver histopathology was evaluated through the severity score of steatosis and vesicular degeneration (0 to 6). The area of hepatocyte [46], as well as the integrated optical densities of glycogen and lipid droplets were determined using Image-Pro Plus 5.1 (USA). Briefly, photographs of HE, PAS and Oil Red O staining sections were taken with a digital microscope camera system (Nikon DS-Ri1, Japan), respectively. For each section, 10 fields of 0.064 mm2 from each image (corresponding to 10 fields at 400× magnification) were analyzed using computer-assisted image-Pro Plus 5.1 (USA) medical morphological analysis software. Briefly, by selecting “color-chosen target” in the option bar of the morphologic analysis system and marking the detected areas (hepatocyte, glycogen and lipid droplets), all the detected areas in the field were marked in color. Then, “calculating” in the option bar was selected to automatically calculate the area of hepatocyte, and the integrated optical density of glycogen and lipid droplets. Integral optical density is the sum of the response intensities of all selected objects in the entire field of view. Integral optical density = average optical density multiplied by the area of the selected object. The higher the integrated optical density, the greater the overall positive reaction intensity.
Determination of the cytokines and adipocytokines in the liver by ELISA
After necropsy, the liver tissue was homogenized with normal saline through a cell homogenizer in an ice bath and centrifuged at 3,000 r/min at 4°C for 10min. The supernatant was conserved for future analysis. The concentrations of TNF-α, IL-1β, IL-6 and IL-8, leptin and resistin in the liver were measured with mouse ELISA kits (H052, H002, H007, H008, H174 and H175, Nanjing Jiancheng Bioengineering Institute, China) according to the manufacturer’s instructions, respectively.
Detection of oxidative stress in the liver
After the mice were euthanized, the liver tissue was homogenized with normal saline through cell homogenizer in an ice bath and centrifuged at 3, 000 r/min at 4°C for 10 min to obtain a clear supernatant. After determining the concentration of total protein in the supernatant of the liver homogenate by BCA protein assay, the glutathione (GSH), malonaldehyde (MDA) contents, and glutathione peroxidase (GSH-Px), superoxide dismutase (SOD) and catalase (CAT) activities in the liver supernatant were measured by biochemical method following the instruction of reagent kits (A006-2, A003-1, A005, A001-3 and A007-1, Nanjing Jiancheng Bioengineering Institute, China).
Apoptosis detection by flow cytometry
The liver tissues were sampled to determine the percentage of apoptotic cells by flow cytometer, similar to the method reported by Chen et al. [47]. Briefly, the excised livers were immediately ground to form a cell suspension and filtered. The cells were washed twice with the cold PBS and were suspended in PBS at a concentration of 1×10⁶cells/mL. Afterward, 5μL of Annexin V-Fluorescein isothiocyanate (V-FITC) and 5μL propidium iodide (PI) were added into 100μL cell suspension, and incubated at 25°C for 15min in the dark. Four hundred microliters of 1×annexin binding buffer (BD Pharmingen, USA, 559763) were added to the mixture, and then, the apoptotic cells were examined by flow cytometry (BD FACSCalibur, USA) within 1h.
Quantitative real-time PCR (qRT-PCR)
The liver tissues were immediately stored in liquid nitrogen. Then, the liver samples were homogenized in liquid nitrogen, by crushing with a mortar and pestle, and the powdered tissues were collected into eppendorf tubes and stored at -80°C. Total RNA was extracted from frozen liver powders using RNAiso Plus (9108/9109, Takara, Japan). The mRNA was then reverse transcribed into cDNA using Prim-Script™ RT reagent Kit (RR047A, Takara, Japan). And then, the cDNA was used as a template for qRT-PCR analysis. For qRT-PCR reactions, 10 μL mixtures were made by using SYBR® Premix Ex Taq™ II (DRR820A, Takara), containing 5μL Tli RNaseH Plus, 0.4μL of forward and 0.4μL of reverse primer, 3.4μL RNAase-free water and 0.8μL cDNA. Gene expressions of Bax, Bcl-2, Caspase-3, and Caspase-9 were analyzed, and β-actin was used as an internal control [48]. The qRT-PCR data were analyzed with 2–ΔΔCT calculation method [49]. The genes primers were designed with Primer 5 and provided by Sangon Biotech (Shanghai, China). Primers information is provided in Table 2.
Table 2. Sequence of primers used in qRT-PCR.
| Gene | Accession number | Forward primer | Reverse primer |
| Caspase3 | NM_009810.3 | ACATGGGAGCAAGTCAGTGG | CGTCCACATCCGTACCAGAG |
| Caspase9 | NM_015733.5 | GAGGTGAAGAACGACCTGAC | AGAGGATGACCACCACAAAG |
| Bax | NM_007527.3 | ATGCGTCCACCAAGAAGC | CAGTTGAAGTTGCCATCAGC |
| Bcl-2 | NM_009741.5 | AGCCTGAGAGCAACCCAAT | AGCGACGAGAGAAGTCATCC |
| β-actin | NM_007393 | GCTGTGCTATGTTGCTCTAG | CGCTCGTTGCCAATAGTG |
Western blot analysis
The liver tissues were lysed and proteins were extracted with RIPA lysis buffer, and then kept in laemmli buffer. Protein samples were separated by SDS-PAGE (10%-15% gels) and transferred to nitrocellulose filter membranes. Membranes were blocked with 5% fat-free milk for 1h and incubated with primary antibodies overnight at 4°C. The primary antibodies were Bax, Bcl-2, Caspase-3, Caspase-9, and GAPDH (Abcam, ab32503, ab182858, ab184787, ab202068, and Cell signaling technology, 5174). The membranes were then washed with Tris-buffered saline (TBS) containing Tween 20 (TBST), and incubated with the biotin-conjugated secondary antibodies (Cell signaling technology, 7074) for 1h, and washed again with TBST. The blots were visualized by ECLTM Chemiluminescence reagent (Beyotime technology, P0018A) and captured on the X-ray film. Then, the statistical data of protein expression was performed with ImageJ2x software.
Statistical analysis
All the data were analyzed by SPSS 22.0. All the results were expressed as mean ± standard deviation (SD). The significance of difference was analyzed by the independent samples t test between two groups, or by variance analyses (LSD or Dunnett’s T3) among four groups. A value of p<0.05 was considered significant.
Author Contributions
Zhicai Zuo conceived the study; Jing Fang, and Kejie Chen designed the experiment; Hetao Song interpreted the results, and wrote the manuscript; Caixia Gao, Ping Ouyang and Zhuangzhi Yang executed experiments and analyzed the data; Junliang Deng, and Yi Geng assisted with writing the manuscript. Hengmin Cui, and Hongrui Guo contributed reagents/materials/analysistools.
Conflicts of Interest
The authors declare no conflicts of interest.
Funding
This work was supported by the program for Changjiang scholars, the University Innovative Research Team (IRT 0848).
References
- 1. Everard A, Cani PD. Diabetes, obesity and gut microbiota. Best Pract Res Clin Gastroenterol. 2013; 27:73–83. https://doi.org/10.1016/j.bpg.2013.03.007 [PubMed]
- 2. Obesity and overweight. World Health Organization Media centre Web site. Available from: http://www.who.int/mediacentre/factsheets/fs311/en/.
- 3. Polyzos SA, Kountouras J, Mantzoros CS. Adipose tissue, obesity and non-alcoholic fatty liver disease. Minerva Endocrinol. 2017; 42:92–108. https://doi.org/10.23736/S0391-1977.16.02563-3 [PubMed]
- 4. Corey KE, Kaplan LM. Obesity and liver disease: the epidemic of the twenty-first century. Clin Liver Dis. 2014; 18:1–18. https://doi.org/10.1016/j.cld.2013.09.019 [PubMed]
- 5. Calle EE, Rodriguez C, Walker-Thurmond K, Thun MJ. Overweight, obesity, and mortality from cancer in a prospectively studied cohort of U.S. adults. N Engl J Med. 2003; 348:1625–38. https://doi.org/10.1056/NEJMoa021423 [PubMed]
- 6. Carabelli J, Burgueño AL, Rosselli MS, Gianotti TF, Lago NR, Pirola CJ, Sookoian S. High fat diet-induced liver steatosis promotes an increase in liver mitochondrial biogenesis in response to hypoxia. J Cell Mol Med. 2011; 15:1329–38. https://doi.org/10.1111/j.1582-4934.2010.01128.x [PubMed]
- 7. Huang YH, Chen CJ, Tang KS, Sheen JM, Tiao MM, Tain YL, Chen CC, Chu EW, Li SW, Yu HR, Huang LT. Postnatal high-fat diet increases liver steatosis and apoptosis threatened by prenatal dexamethasone through the oxidative effect. Int J Mol Sci. 2016; 17:369. https://doi.org/10.3390/ijms17030369 [PubMed]
- 8. Jazet IM, Pijl H, Meinders AE. Adipose tissue as an endocrine organ: impact on insulin resistance. Neth J Med. 2003; 61:194–212. [PubMed]
- 9. Koenig SM. Pulmonary complications of obesity. Am J Med Sci. 2001; 321:249–79. https://doi.org/10.1097/00000441-200104000-00006 [PubMed]
- 10. Jubber AS. Respiratory complications of obesity. Int J Clin Pract. 2004; 58:573–80. https://doi.org/10.1111/j.1368-5031.2004.00166.x [PubMed]
- 11. Packham DR, Sorrell TC. Pneumonia with bacteraemia due to Escherichia coli. Aust N Z J Med. 1981; 11:669–72. https://doi.org/10.1111/j.1445-5994.1981.tb03545.x [PubMed]
- 12. Gruberg L, Weissman NJ, Waksman R, Fuchs S, Deible R, Pinnow EE, Ahmed LM, Kent KM, Pichard AD, Suddath WO, Satler LF, Lindsay J
Jr . The impact of obesity on the short-term and long-term outcomes after percutaneous coronary intervention: the obesity paradox? J Am Coll Cardiol. 2002; 39:578–84. https://doi.org/10.1016/S0735-1097(01)01802-2 [PubMed] - 13. Nie W, Zhang Y, Jee SH, Jung KJ, Li B, Xiu Q. Obesity survival paradox in pneumonia: a meta-analysis. BMC Med. 2014; 12:61. https://doi.org/10.1186/1741-7015-12-61 [PubMed]
- 14. Wan T, Yuan G, Ren Y, Zuo Z, Wang Z, Jia Y, Cui H, Peng X, Fang J, Deng J, Yu S, Hu Y, Shen L, et al. Diet-induced obese mice exhibit altered immune responses to acute lung injury induced by Escherichia coli. Obesity (Silver Spring). 2016; 24:2101–10. https://doi.org/10.1002/oby.21608 [PubMed]
- 15. Wang F, Zuo Z, Chen K, Fang J, Cui H, Shu G, Zhou Y, Chen Z, Huang C, Liu W. Histopathological changes caused by inflammation and oxidative stress in diet-induced-obese mouse following experimental lung injury. Sci Rep. 2018; 8:14250. https://doi.org/10.1038/s41598-018-32420-3 [PubMed]
- 16. Fang J, Wang F, Song H, Wang Z, Zuo Z, Cui H, Jia Y, Deng J, Yu S, Hu Y, Shen L, Ma X, Ren Z, Gou L. AMPKα pathway involved in hepatic triglyceride metabolism disorder in diet-induced obesity mice following Escherichia coli Infection. Aging (Albany NY). 2018; 10:3161–72. https://doi.org/10.18632/aging.101623 [PubMed]
- 17. Jinks MF, Kelly CA. The pattern and significance of abnormal liver function tests in community-acquired pneumonia. Eur J Intern Med. 2004; 15:436–40. https://doi.org/10.1016/j.ejim.2004.06.011 [PubMed]
- 18. Matuschak GM, Pinsky MR, Klein EC, Van Thiel DH, Rinaldo JE. Effects of D-galactosamine-induced acute liver injury on mortality and pulmonary responses to Escherichia coli lipopolysaccharide. Modulation by arachidonic acid metabolites. Am Rev Respir Dis. 1990; 141:1296–306. https://doi.org/10.1164/ajrccm/141.5_Pt_1.1296 [PubMed]
- 19. Pi-Sunyer X. The medical risks of obesity. Postgrad Med. 2009; 121:21–33. https://doi.org/10.3810/pgm.2009.11.2074 [PubMed]
- 20. Corrales-Medina VF, Valayam J, Serpa JA, Rueda AM, Musher DM. The obesity paradox in community-acquired bacterial pneumonia. Int J Infect Dis. 2011; 15:e54–57. https://doi.org/10.1016/j.ijid.2010.09.011 [PubMed]
- 21. Choi SS, Diehl AM. Hepatic triglyceride synthesis and nonalcoholic fatty liver disease. Curr Opin Lipidol. 2008; 19:295–300. https://doi.org/10.1097/MOL.0b013e3282ff5e55 [PubMed]
- 22. Jones SA, Jorgensen M, Chowdhury FZ, Rodgers R, Hartline J, Leatham MP, Struve C, Krogfelt KA, Cohen PS, Conway T. Glycogen and maltose utilization by Escherichia coli O157:H7 in the mouse intestine. Infect Immun. 2008; 76:2531–40. https://doi.org/10.1128/IAI.00096-08 [PubMed]
- 23. Alkhouri N, Carter-Kent C, Feldstein AE. Apoptosis in nonalcoholic fatty liver disease: diagnostic and therapeutic implications. Expert Rev Gastroenterol Hepatol. 2011; 5:201–12. https://doi.org/10.1586/egh.11.6 [PubMed]
- 24. Liu LM, Zhang JX, Luo J, Guo HX, Deng H, Chen JY, Sun SL. A role of cell apoptosis in lipopolysaccharide (LPS)-induced nonlethal liver injury in D-galactosamine (D-GalN)-sensitized rats. Dig Dis Sci. 2008; 53:1316–24. https://doi.org/10.1007/s10620-007-9994-y [PubMed]
- 25. Kannan K, Jain SK. Oxidative stress and apoptosis. Pathophysiology. 2000; 7:153–63. https://doi.org/10.1016/S0928-4680(00)00053-5 [PubMed]
- 26. Buttke TM, Sandstrom PA. Oxidative stress as a mediator of apoptosis. Immunol Today. 1994; 15:7–10. https://doi.org/10.1016/0167-5699(94)90018-3 [PubMed]
- 27. Kambe M, Kambe N, Oskeritzian CA, Schechter N, Schwartz LB. IL-6 attenuates apoptosis, while neither IL-6 nor IL-10 affect the numbers or protease phenotype of fetal liver-derived human mast cells. Clin Exp Allergy. 2001; 31:1077–85. https://doi.org/10.1046/j.1365-2222.2001.01126.x [PubMed]
- 28. Bansal MB, Kovalovich K, Gupta R, Li W, Agarwal A, Radbill B, Alvarez CE, Safadi R, Fiel MI, Friedman SL, Taub RA. Interleukin-6 protects hepatocytes from CCl4-mediated necrosis and apoptosis in mice by reducing MMP-2 expression. J Hepatol. 2005; 42:548–56. https://doi.org/10.1016/j.jhep.2004.11.043 [PubMed]
- 29. Abdollahi T, Robertson NM, Abdollahi A, Litwack G. Inhibition of TRAIL-induced apoptosis by IL-8 is mediated by the p38-MAPK pathway in OVCAR3 cells. Apoptosis. 2005; 10:1383–93. https://doi.org/10.1007/s10495-005-2139-x [PubMed]
- 30. Fukunishi S, Nishio H, Fukuda A, Takeshita A, Hanafusa T, Higuchi K, Suzuki K. Development of fibrosis in nonalcoholic steatosis through combination of a synthetic diet rich in disaccharide and low-dose lipopolysaccharides in the livers of zucker (fa/fa) rats. J Clin Biochem Nutr. 2009; 45:322–28. https://doi.org/10.3164/jcbn.09-50 [PubMed]
- 31. Ubags ND, Vernooy JH, Burg E, Hayes C, Bement J, Dilli E, Zabeau L, Abraham E, Poch KR, Nick JA, Dienz O, Zuñiga J, Wargo MJ, et al. The role of leptin in the development of pulmonary neutrophilia in infection and acute lung injury. Crit Care Med. 2014; 42:e143–51. https://doi.org/10.1097/CCM.0000000000000048 [PubMed]
- 32. Johansson L, Linnér A, Sundén-Cullberg J, Treutiger CJ, Norrby-Teglund A. Resistin in severe bacterial infections. Crit Care. 2007 (Suppl 4); 11:10. https://doi.org/10.1186/cc5989
- 33. Serbetçi K, Uysal O, Erkasap N, Köken T, Baydemir C, Erkasap S. Anti-apoptotic and antioxidant effect of leptin on CCl4-induced acute liver injury in rats. Mol Biol Rep. 2012; 39:1173–80. https://doi.org/10.1007/s11033-011-0847-6 [PubMed]
- 34. Liu Z, Shi A, Song D, Han B, Zhang Z, Ma L, Liu D, Fan Z. Resistin confers resistance to doxorubicin-induced apoptosis in human breast cancer cells through autophagy induction. Am J Cancer Res. 2017; 7:574–83. [PubMed]
- 35. Amundson DE, Djurkovic S, Matwiyoff GN. The obesity paradox. Crit Care Clin. 2010; 26:583–96. https://doi.org/10.1016/j.ccc.2010.06.004 [PubMed]
- 36. Furukawa S, Fujita T, Shimabukuro M, Iwaki M, Yamada Y, Nakajima Y, Nakayama O, Makishima M, Matsuda M, Shimomura I. Increased oxidative stress in obesity and its impact on metabolic syndrome. J Clin Invest. 2004; 114:1752–61. https://doi.org/10.1172/JCI21625 [PubMed]
- 37. Pompella A, Visvikis A, Paolicchi A, De Tata V, Casini AF. The changing faces of glutathione, a cellular protagonist. Biochem Pharmacol. 2003; 66:1499–503. https://doi.org/10.1016/S0006-2952(03)00504-5 [PubMed]
- 38. Li W, Lu Y. Hepatoprotective effects of eophoricoside against fructose-induced liver injury via regulating lipid metabolism, oxidation, and inflammation in mice. J Food Sci. 2018; 83:552–58. https://doi.org/10.1111/1750-3841.14047 [PubMed]
- 39. McCallister JW, Adkins EJ, O’Brien JM
Jr . Obesity and acute lung injury. Clin Chest Med. 2009; 30:495–508, viii. https://doi.org/10.1016/j.ccm.2009.05.008 [PubMed] - 40. Yang GL, Jia LQ, Wu J, Ma YX, Cao HM, Song N, Zhang N. Effect of tanshinone IIA on oxidative stress and apoptosis in a rat model of fatty liver. Exp Ther Med. 2017; 14:4639–46. https://doi.org/10.3892/etm.2017.5162 [PubMed]
- 41. Trefler S, Rodríguez A, Martín-Loeches I, Sanchez V, Marín J, Llauradó M, Romeu M, Díaz E, Nogués R, Giralt M. Oxidative stress in immunocompetent patients with severe community-acquired pneumonia. A pilot study. Med Intensiva. 2014; 38:73–82. https://doi.org/10.1016/j.medin.2013.01.004 [PubMed]
- 42. Sugino K, Dohi K, Yamada K, Kawasaki T. The role of lipid peroxidation in endotoxin-induced hepatic damage and the protective effect of antioxidants. Surgery. 1987; 101:746–52. [PubMed]
- 43. Gonzalez D, Bejarano I, Barriga C, Rodriguez AB, Pariente JA. Oxidative stress-induced caspases are regulated in human myeloid HL-60 cells by calcium signal. Curr Signal Transduct Ther. 2010; 5:181–86. https://doi.org/10.2174/157436210791112172
- 44. Czabotar PE, Lessene G, Strasser A, Adams JM. Control of apoptosis by the BCL-2 protein family: implications for physiology and therapy. Nat Rev Mol Cell Biol. 2014; 15:49–63. https://doi.org/10.1038/nrm3722 [PubMed]
- 45. Raisova M, Hossini AM, Eberle J, Riebeling C, Wieder T, Sturm I, Daniel PT, Orfanos CE, Geilen CC. The Bax/Bcl-2 ratio determines the susceptibility of human melanoma cells to CD95/Fas-mediated apoptosis. J Invest Dermatol. 2001; 117:333–40. https://doi.org/10.1046/j.0022-202x.2001.01409.x [PubMed]
- 46. Xu X, Chen N, Liu Z, Gou S, Yin J. Effects of dietary starch sources and levels on liver histology in largemouth bass, Micropterus salmoides. Shanghai Haiyang Daxue Xuebao [Article in Chinese]. 2016.
- 47. Chen T, Cui H, Cui Y, Bai C, Gong T, Peng X. Cell-cycle blockage associated with increased apoptotic cells in the thymus of chickens fed on diets high in fluorine. Hum Exp Toxicol. 2011; 30:685–92. https://doi.org/10.1177/0960327110379022 [PubMed]
- 48. Ani DD, Bolha L, Narat M, Oven I. Setting up a gene expression study for tissue cells by method of quantitative real-time PCR. Acta Agric Slov. 2012; 100:19–28. https://doi.org/10.2478/v10014-012-0018-z
- 49. Livak KJ, Schmittgen TD. Analysis of relative gene expression data using real-time quantitative PCR and the 2(-Delta Delta C(T)) method. Methods. 2001; 25:402–08. https://doi.org/10.1006/meth.2001.1262 [PubMed]