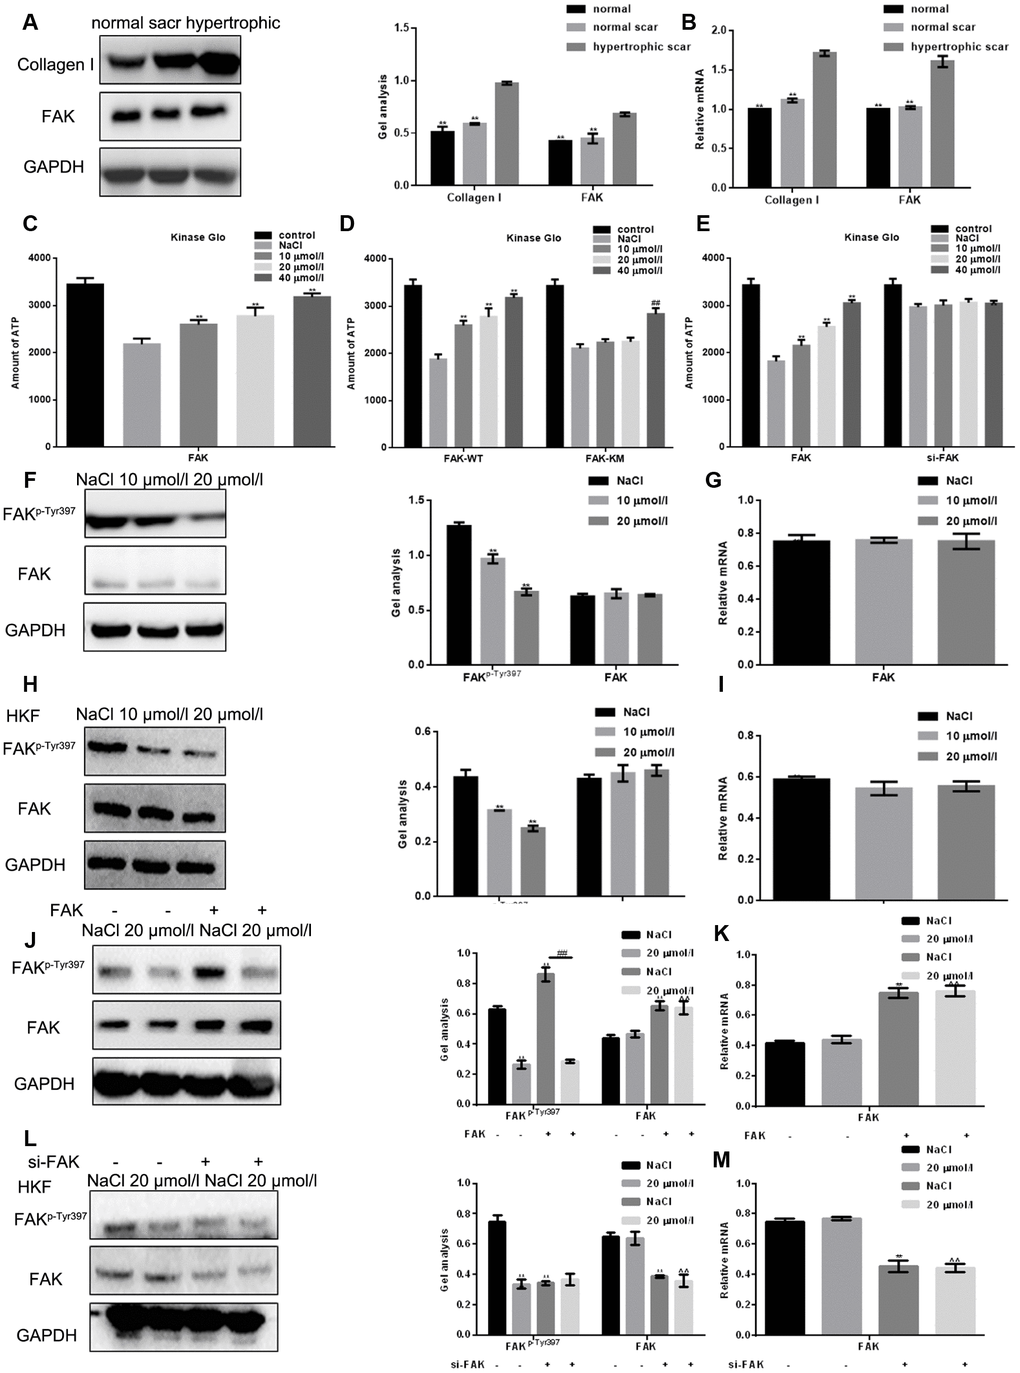
Figure 2.Apigenin suppresses the kinase activity of FAK and inhibits FAK phosphorylation. (A, B) Western blot and real-time PCR analyses showing the Collagen I and FAK content in normal skin tissue, normal scar tissue and hypertrophic scar tissue. ** P < 0.05 vs. hypertrophic scar tissue. (C) Kinase Glo luminescence assays showing the inhibitory effect of apigenin on the kinase activity of FAK; 2 μM ALX was used as an activated control. Data are shown as the mean ± SD. ** P < 0.05 vs. NaCl-treated FAK group. (D) Kinase Glo luminescence assays comparing the inhibitory effects of apigenin on the kinase activities of FAK-WT and FAK-KM(Y397A); 2 μmol ALX used as an activated control. Data are shown as the mean ± SD. ** P < 0.05 vs. NaCl-treated FAK-WT group; ## P < 0.05 vs. NaCl-treated FAK-KM (Y397A) group. (E) Kinase Glo luminescence assays examining the inhibitory effects of apigenin on the kinase activities of FAK in HSFs transfected with si-FAK; 2 μmol ALX used as an activated control. Data are shown as the mean ± SD. ** P < 0.05 vs. NaCl-treated FAK group. (F–I) Western blot and real-time PCR analyses of FAKp-Tyr397 and FAK levels in HSFs and HKFs treated for 24 h with NaCl or the indicated concentration of apigenin. **P < 0.05 vs. NaCl. (J, K) Western blot and real-time PCR analyses of the effect of 20 μM apigenin FAKp-Tyr397 and FAK levels in HSFs overexpressing empty vector or FAK. **P < 0.05 vs. NaCl group; ## P < 0.05 vs. NaCl with FAK-overexpressed group. (L, M) Western blot and real-time PCR analyses of the effect of 20 μM apigenin on FAKp-Tyr397 and FAK levels in HSFs transfected with si-FAK or si-NC (negative control). **P < 0.05 vs. NaCl group.