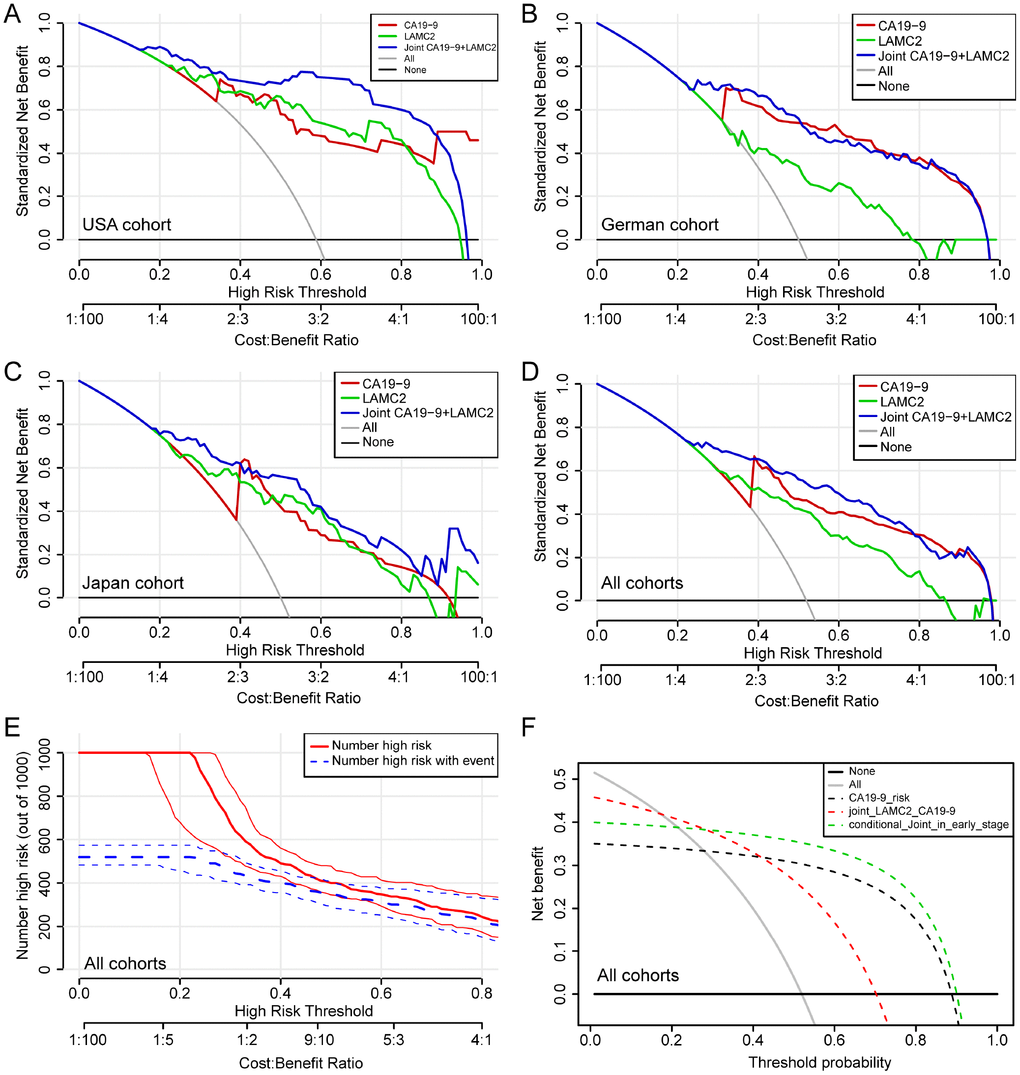
Figure 7.Decision curve analysis for the serum levels of LAMC2 and CA19-9 in PDAC patients. (A–D) Net benefit of LAMC2 and CA19-9 threshold probability from USA, German, Japan and combined cohorts, respectively. (E) Net benefit and Bootstrapping with PDAC high risk number resamples per 1000 patients of LAMC2 and CA19-9 threshold probability from the combined cohort. The red line indicates the number of people who are classified as positive (high risk) by the joint serum model under each threshold probability; the blue line (the number of high risk with event) is the number of true positives under each threshold probability. (F) Joint and conditional decision curve analysis of LAMC2 and CA19-9 threshold probability of all cohorts. The red dotted line represents the joint high serum levels of LAMC2 and CA19-9. The green dotted line represents joint high serum levels of LAMC2 and CA19-9 in early stage and operable PDAC patients.