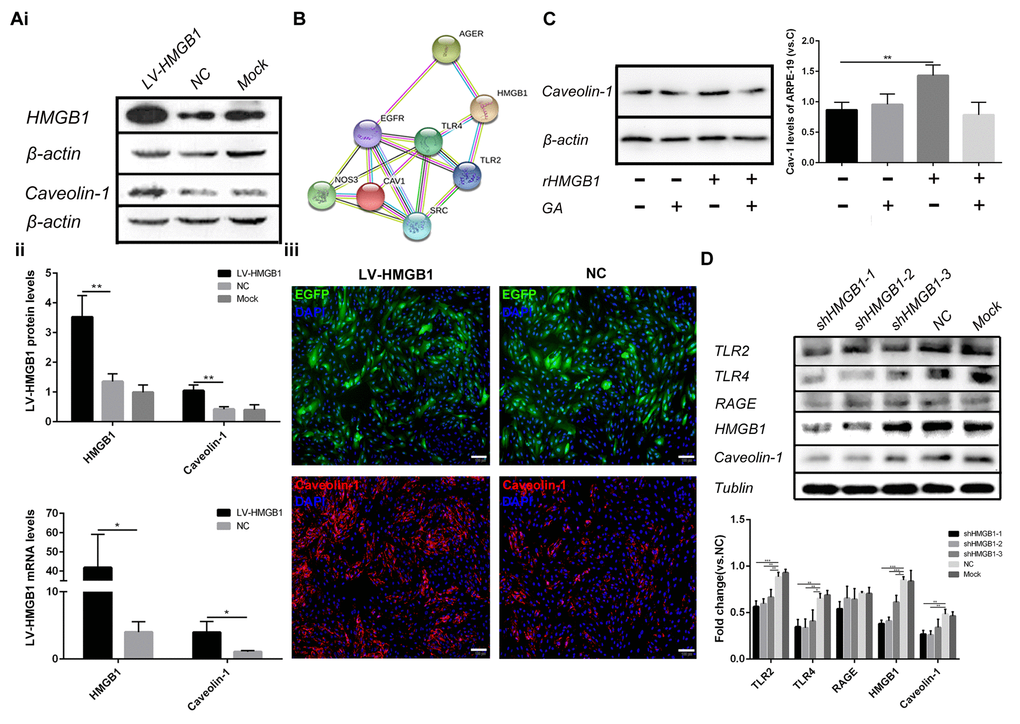
Figure 3.HMGB1 upregulation and release increase the expression of Caveolin-1. (A) (i) Western blot analyses showed that overexpression of HMGB1 upregulated Caveolin-1; β-actin was used as the loading control; Western blot results were quantified by densitometry, and the results are expressed as a ratio with β-actin. (ii) qPCR analyses showed that overexpression of HMGB1 upregulated Caveolin-1. Data are presented as means ± SD; * indicates a p value < 0.05, ** indicates a p value < 0.01, n=3. (iii) Expression of EGFP and Caveolin-1 was assessed by immunofluorescence in HMGB1-overexpressing RPE cells and negative-control RPE cells. (B) Protein interaction between HMGB1 and Caveolin-1 was revealed by the STRING version 9.1 program. (C) Relative Caveolin-1expression in RPE cell incubated with normal medium, 1μg/ml rHMGB1, 100μM GA, or 1μg/ml rHMGB1+100μM GA, Data are presented as means ± SD; * indicates a p value < 0.05, ** indicates a p value < 0.01, n=3. (D) Western blot analyses showed that knock-down of HMGB1 downregulated Caveolin-1; Tublin was used as the loading control, western blot results were quantified by densitometry, and the results are expressed as a ratio with Tublin. Data are presented as means ± SD; * indicates a p value < 0.05, ** indicates a p value < 0.01, n=3.