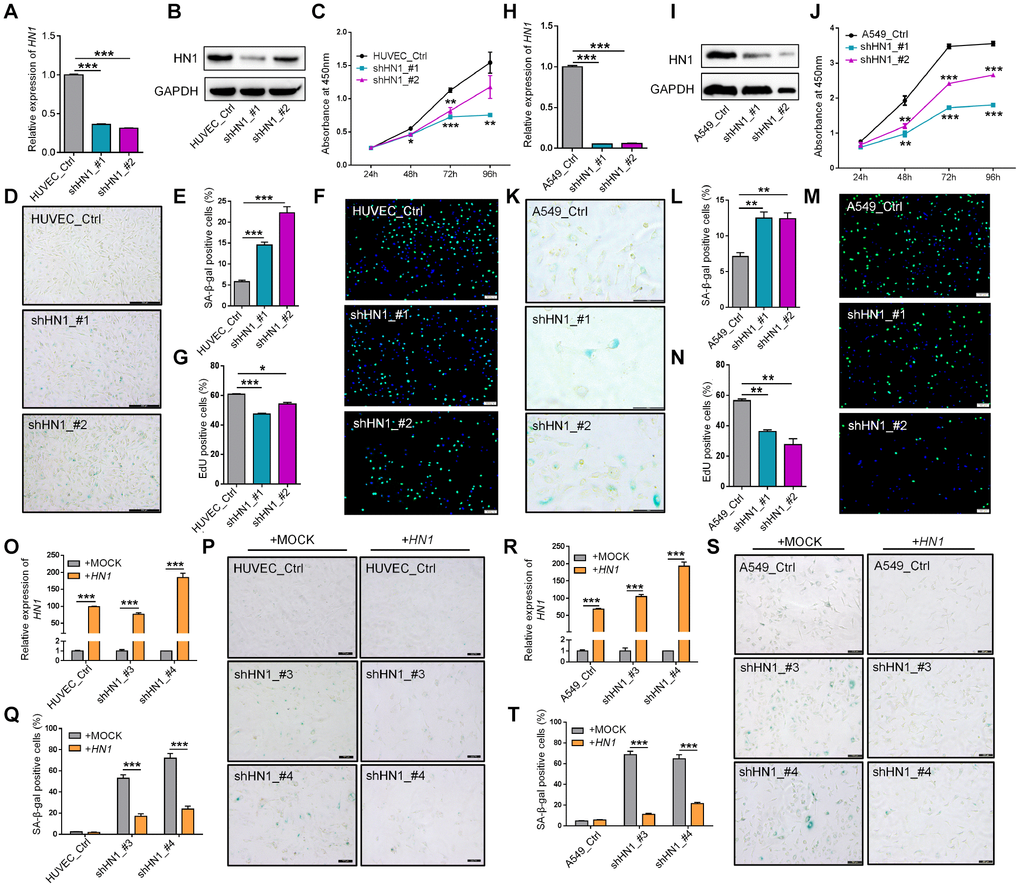
Figure 3.Knockdown of HN1 induces cellular senescence in normal and cancer cells. (A–B) Validation of HN1 knockdown (KD) in HUVEC with two shRNAs (shHN1_#1, shHN1_#2), as quantified by qRT-PCR (A) and Western blot (B), respectively. GAPDH served as internal control for both mRNA and protein. (C) Cell proliferation rate evaluated by Cell Counting Kit-8 (CCK-8) assay in HN1-KD HUVEC cells with two shRNAs. *, ** and *** stand for p < 0.05, p < 0.01 and p < 0.001, respectively, based on t-test with three biological replicates. (D–E) Representative SA-β-Gal staining (D) and quantitative statistics (E) in HN1-KD and control HUVEC cells. *** represents p < 0.001 based on t-test with three independent countings. (F–G) EdU incorporation assay (F) and quantitative statistics (G) in HN1-KD and control HUVEC cells. Green and blue dots stand for incorporated EdU and DNA DAPI (4',6-diamidino-2-phenylindole) staining, respectively. * and *** stand for p < 0.05 and p < 0.001, respectively, based on t-test with three independent countings. (H–I) Validation of HN1 knockdown in A549 cells, as described in panel A-B. (J) Cell proliferation rate evaluated by CCK-8 assay in HN1-KD A549 cells, as described in panel C. (K–L) SA-β-Gal staining (K) and quantitative statistics (L) were shown in A549 cells, as described in panel D-E. ** represents p < 0.01 based on t-test with three independent countings. (M–N) EdU incorporation assay (M) and positive cell (EdU incorporated) statistics (N) were shown in A549 cells, as described in panel F-G. ** represents p < 0.01 based on t-test with three independent countings. (O–Q) Over-expression of HN1 partially rescued HN1-KD induced SA-β-Gal activity in HUVECs. qRT-PCR confirmed overexpression of HN1 in HN1-KD HUVECs (O). *** represents p < 0.001 based on t-test with three qPCR reactions. SA-β-Gal staining (P), and positive staining cell statistics (Q) in control (+MOCK) and overexpression (+HN1) HUVECs. *** represents p < 0.001 based on t-test with three independent countings. (R–T) Over-expression of HN1 partially rescued HN1-KD induced SA-β-Gal activity in A549 cells. qRT-PCR confirmed overexpression of HN1 in HN1-KD A549 cells (R). SA-β-Gal staining (S) and positive staining cell statistics (T) in control (+MOCK) and overexpression (+HN1) A549 cells. *** represents p < 0.001, as described in panel O-Q.