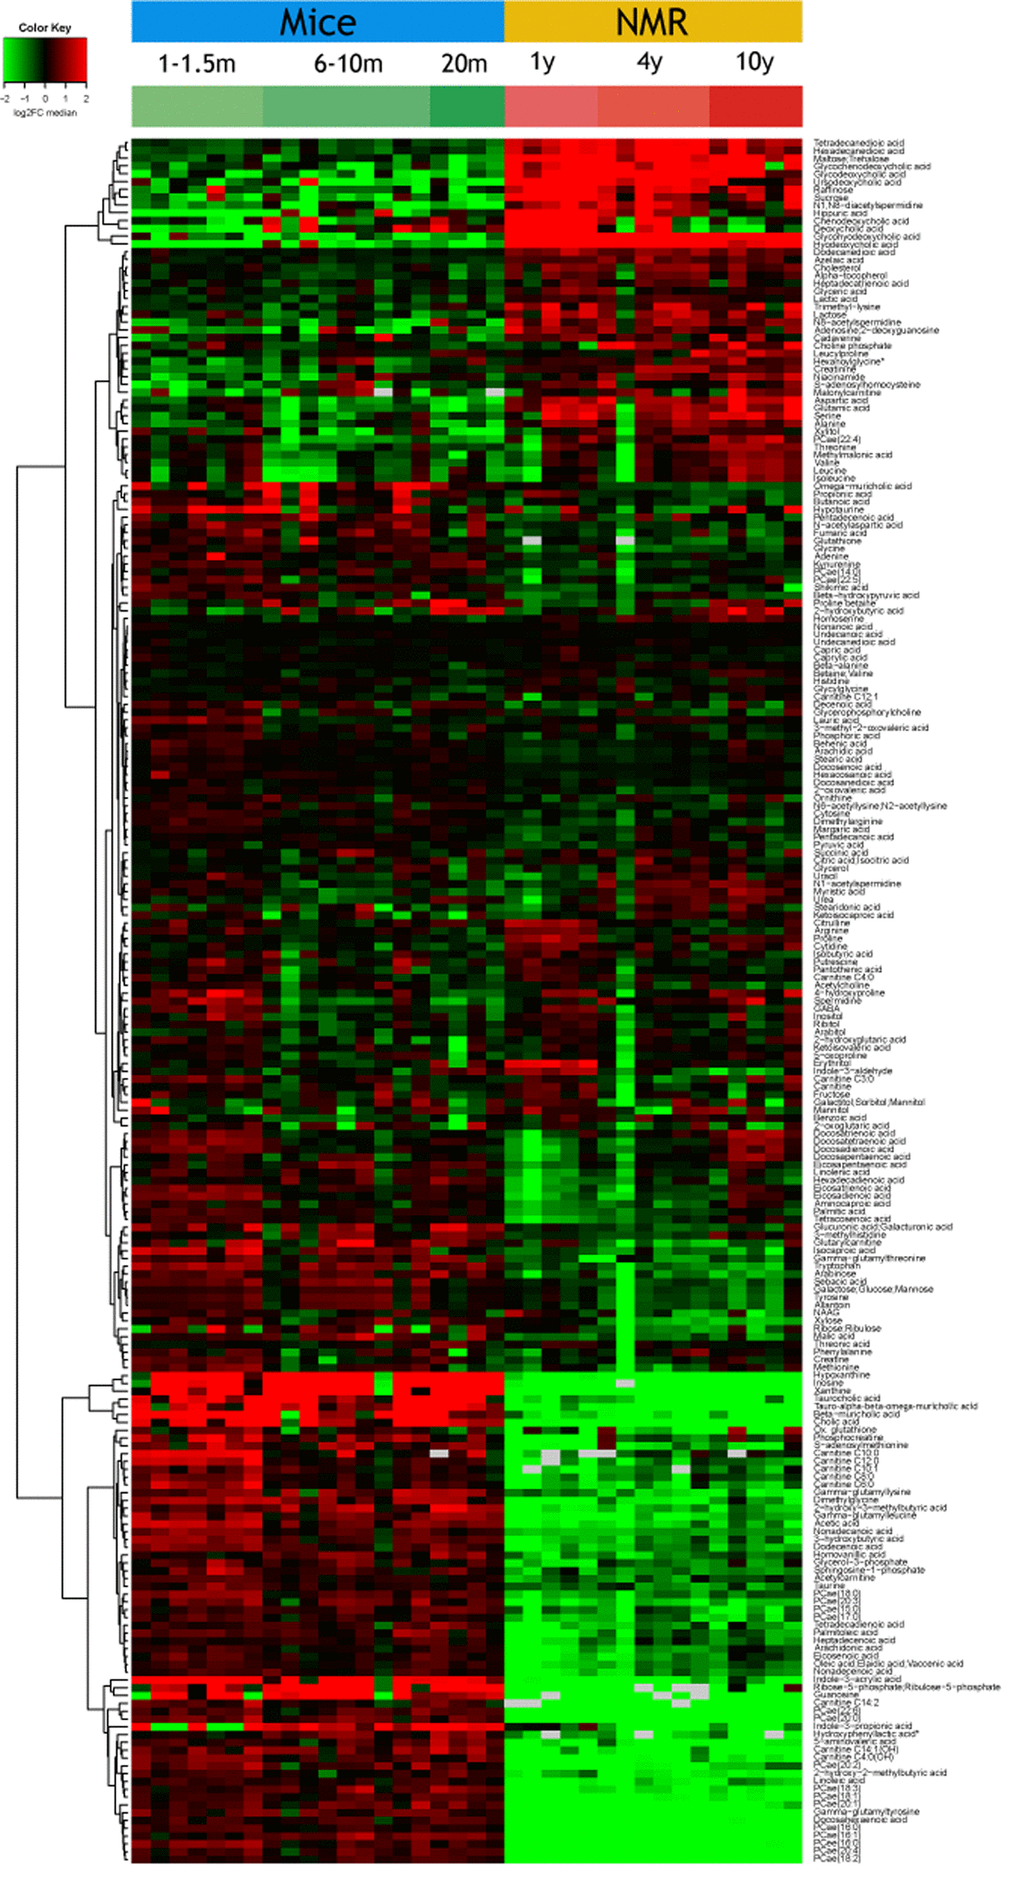
Figure 1.Overview of the plasma metabolome in the two rodents. The abundance of each metabolite is indicated for each mouse or naked mole-rat (NMR) as a heat map (red = high, green=low). Results were subjected to hierarchical clustering to indicate the increase (upper part) or decreased (lower part) of metabolites in NMR as compared to mice. Note that the raw data are listed in Supplementary Table 1.
Figure 1 — The metabolomic signature of extreme longevity: naked mole rats versus mice | Aging