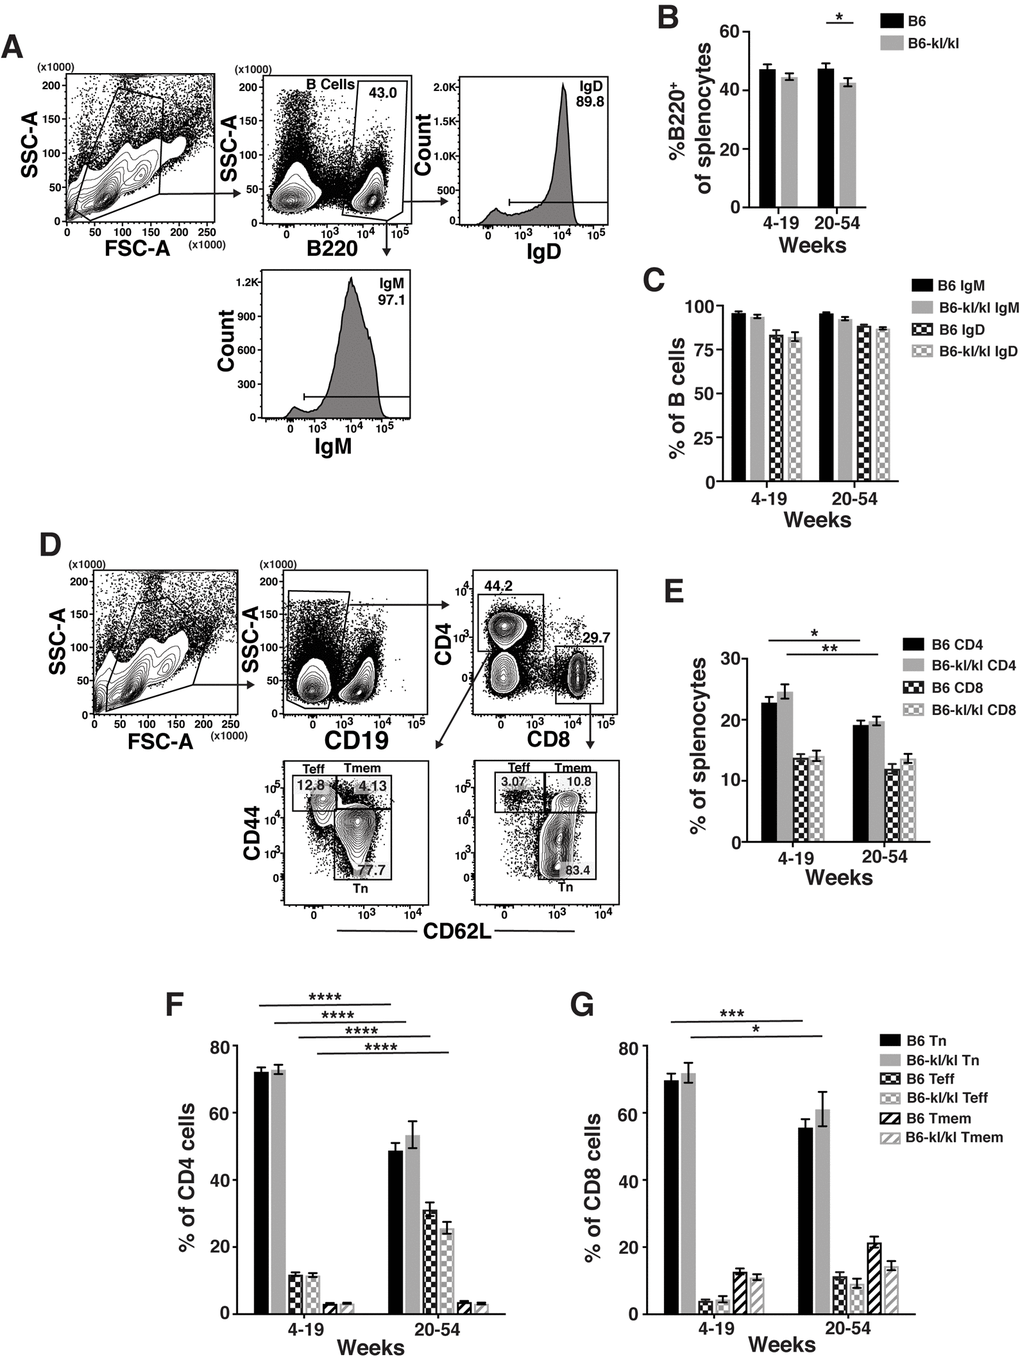
Figure 5.Adaptive immune cell composition in the spleen is similar in C57BL/6 and B6-kl/kl mice. (A) Representative flow cytometry plots of splenic B cells. Frequency of (B) total B cells and (C) IgM+ or IgD+ B cells in the spleen of C57BL/6 and B6-kl/kl mice at 4-19 weeks (C57BL/6 n=18 and B6-kl/kl n=18) and 20+ weeks (C57BL/6 n=16 and B6-kl/kl n=23) of age from pooled male and female mice. Bars represent the standard error mean. Statistical significance determined by 2way ANOVA and Tukey’s multiple comparison test: * p ≤ 0.05. (D) Representative flow cytometry plots of splenic naïve (Tn; CD62L+CD44lo), effector-phenotype (Teff; CD44hiCD62lo), and memory-phenotype (Tmem; CD44hiCD62+) CD4 T cells (CD19-CD4+) and CD8 T cells (CD19-CD8+). (E) Frequency of CD4 and CD8 T cells. C57BL/6 n=24, 4-19 weeks; n=25, 20+ weeks. B6-kl/kl n=19, 4-19 weeks; n=19, 20+ weeks. Statistical significance determined by 2way ANOVA and Tukey’s multiple comparison test: * p ≤ 0.05 and ** p ≤ 0.001. Bars represent the standard error mean. Frequency of naïve, effector-phenotype, and memory-phenotype of (F) CD4 T cells and (G) CD8 T cells. C57BL/6 n=24, 4-19 weeks; n=25, 20+ weeks. B6-kl/kl n=19, 4-19 weeks; n=19, 20+ weeks. Statistical significance determined by 2way ANOVA and Tukey’s multiple comparison test: *** p ≤ 0.001 and **** p ≤ 0.0001. Bars represent the standard error mean.