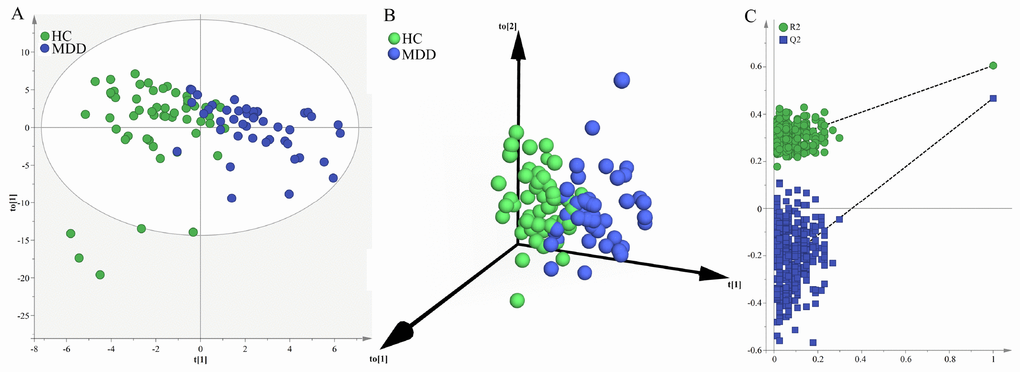
Figure 1.Metabolomic analysis of urine samples from the young populations. (A) OPLS-DA model showed an obvious separation between young HCs (green circle) and young MDD patients (blue circle); (B) 3D view also showed an obvious separation between young HCs (green sphere) and young MDD patients (blue sphere); (C) the permutation test suggested the validity of the model, as the Q2 and R2 values yielded by the permutation test (left bottom) were lower than their original values (upper right).