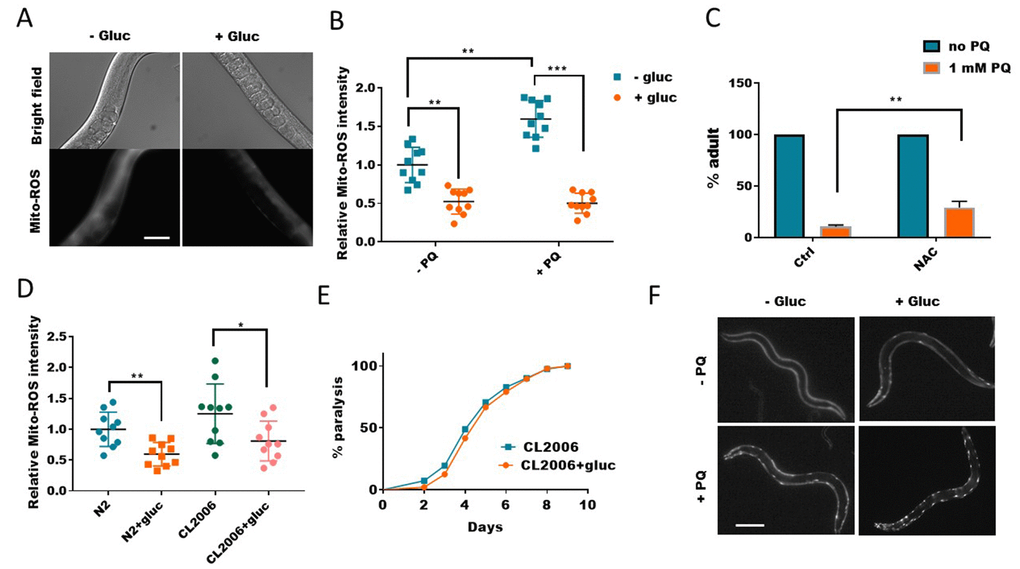
Figure 2.Glucose suppresses mitochondrial reactive oxygen species (ROS) generation. (A) Glucose suppressed paraquat-induced mitochondrial ROS. C. elegans were raised in the absence or presence of 0.5% glucose to L4/young adult stage then transferred to NGM agar plate containing 1mM paraquat for 24 hours. Animals were washed and incubated with Mitotracker-Red-Ros dye in M9 buffer for 2 hours. After extensive wash in M9 buffer, animals were raised on NGM agar plate for 4 hours then imaged by using fluorescence microscope. Experiments were repeated > 3 times. Representative images were shown. Scale bar: 60μm. (B) Glucose suppressed both WT and paraquat-induced mitochondrial ROS. Experiments were carried out as in (A). 10 images from multiple experiments were randomly selected and the fluorescence intensity (signal/area) was quantified by using ImageJ software. The average intensity of controls (no glucose and no paraquat) was defined as 1, to which all values were normalized. Error bars stand for standard deviation. P values by student’s t-test: **, P<0.005; *** P<0.0005. (C) Decreasing ROS alleviated paraquat from inhibiting development in C. elegans. Worms were raised on NGM agar plate containing 10mM antioxidant NAC (n-acetylcysteine) and 1mM paraquat (PQ) from hatching for 4 days. The mean percentage of animals that reached adulthood from 3 independent experiments (n>250) was plotted, with error bars showing standard deviation. P values by student’s t-test: **, P<0.005. (D) The elevated ROS levels in Aβ-expressing worms were decreased by glucose treatment. Wild-type (N2) and human Aβ-expressing worms (CL2006) were raised in the absence or presence of 0.5% glucose until day-1 adulthood. Worms were washed and stained with Mitotracker-Red-Ros dye as in (A). 10 images from 2 experiments were randomly selected and fluorescence intensity was quantified by using ImageJ software. Data were normalized to the mean intensity of N2 wild-type. Error bars stand for standard deviation. P values by student’s t-test: *, P<0.05; ** P<0.005. (E) Glucose suppression of ROS did not improve the paralysis of Aβ-expressing worms (CL2006). Animals were raised on NGM agar plate with and without 0.5% glucose from hatching at 25°C. Animals that no longer moved forward after gentle touch for 3 times were defined as paralyzed animals. Data were pooled from 3 independent experiments and plotted and statistically analyzed by using Prism software. P values by Log-rank test: not significant. (F) Glucose suppression of ROS exacerbated poly glutamine (polyQ35) aggregation in body wall muscle of C. elegans. Worms expressing polyQ35::YFP were raised in the absence or presence of 0.5% D-glucose to L4 stage, then transferred to NGM agar plate containing 1mM paraquat (PQ) for 2 days. Worms were picked and imaged with fluorescence microscope. Representative images of at least 3 independent experiments were shown. Scale bar: 200μm.