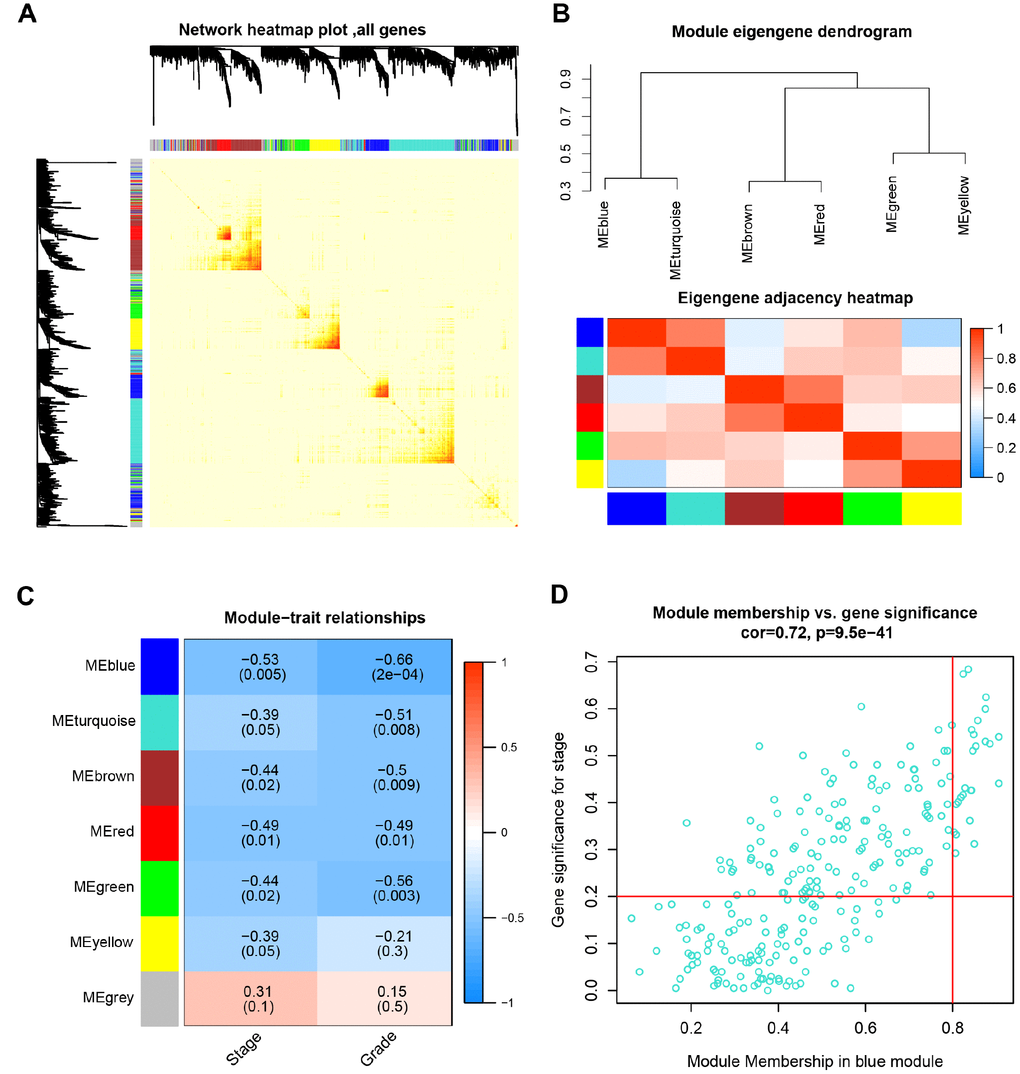
Figure 3.Identification of modules associated with the clinical traits. (A) Interaction relationship analysis of co-expression genes. Different colors of horizontal axis and vertical axis represent different modules. The brightness of yellow in the middle represents the degree of connectivity of different modules. There was no significant difference in interactions among different modules, indicating a high-scale independence degree among these modules. (B) Module eigengene dendrogram and eigengene network heatmap summarize the modules yielded in the clustering analysis. (C) Heatmap of the correlation between module eigengenes and pathological stage and grade. The blue module was significantly correlated with stage and grade. (D) Scatter plot of module eigengenes in blue module.