


Introduction
Renal cell carcinoma is common urinary malignancy, which accounts for about 3% of all malignant tumors. In the urinary system, the incidence rate is second to the bladder cancer. According to global cancer statistics 2018, around 403,262 (2.2%) new cases of kidney cancer are diagnosed, and approximately 175,098 (1.8%) died of the disease [1]. Clear cell renal cell carcinoma (ccRCC) is the most common subtype of renal cell carcinoma. It accounts for approximately 80%-90% of renal cell carcinoma [2].
Currently, about 30% of patients are diagnosed with disease that is already in the metastatic stage [3]. For patients with advanced ccRCC or cancer recurrence, a number of molecule-targeted drugs have been used as clinical first-line therapy, including sorafenib, sunitinib, aldesleukin, axitinib and bevacizumab. Compared with chemoradiotherapy, the survival time has been greatly improved. However, because of the side effects of molecule-targeted drugs and individual differences of patient sensitivity to drugs, median disease-free and overall survival times of patients remain short [4]. Therefore, it is of great significance to further explore more effective prognostic biomarkers and therapeutic targets.
With the popularization and gradual development of gene chips and high-throughput sequencing, it is possible to identify the key genes associated with tumor progression and prognosis based on big data integration and bioinformatics. Weighted gene co-expression network analysis (WGCNA) is a systematic biological method that could identify highly synergistically altered gene sets, and based on the intrinsic properties of gene sets and correlation between gene sets and phenotypes, candidate biomarker genes or therapeutic targets can be screened out. The aim of this study was to identify and validate key genes that were significantly associated with oncogenesis and progression in ccRCC tumors by weighted correlation network analysis, and further screen correlated small molecule target drugs.
Results
Differentially expressed genes (DEGs) screening of ccRCC
After data preprocessing and quality assessment, expression matrices of three expression profiles were obtained, including GSE36895, GSE53757 and GSE66272. Using |log2FC| > 1 and FDR < 0.05 as the threshold, all the differentially expressed genes were screened out in three expression profiles (Supplementary Tables 2–4). The DEGs of three datasets were shown as volcano plots in Figure 1A–1C. After being overlapped, the common 1387 genes were identified, including 673 upregulated and 714 downregulated genes (Figure 1D–1E).
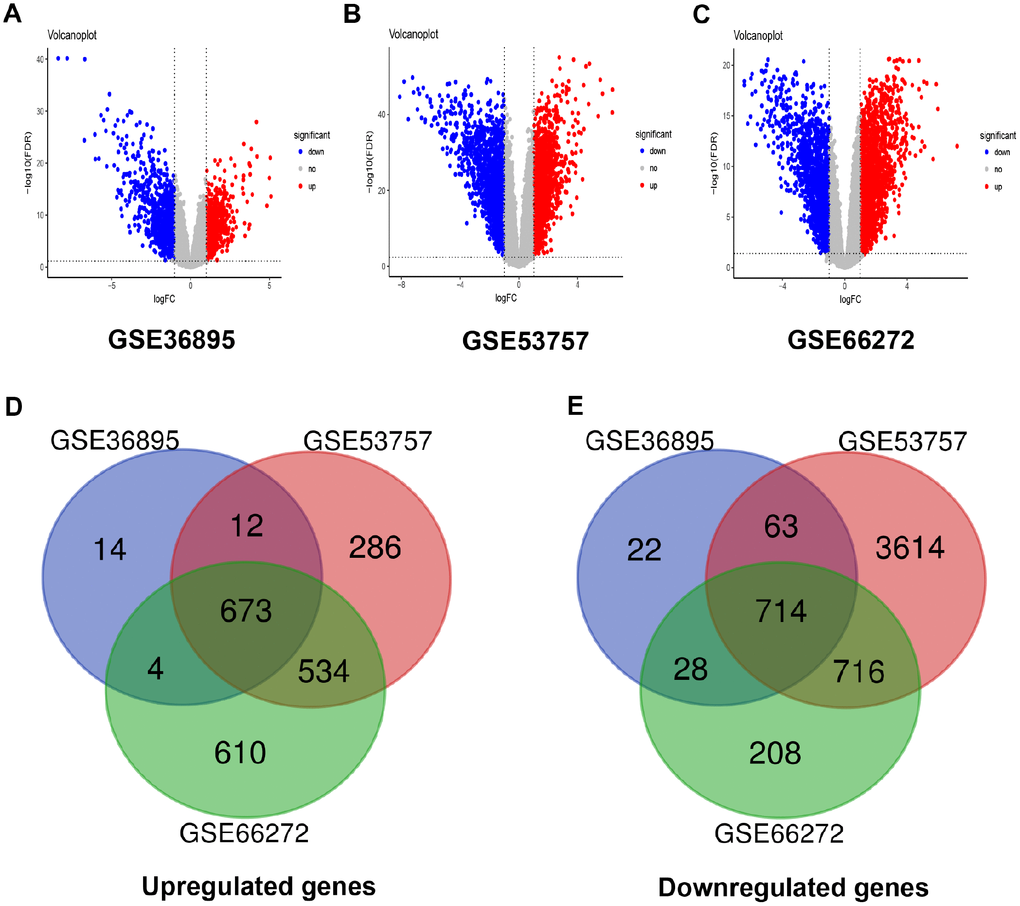
Figure 1. Differentially expressed genes and common differentially expressed genes in three datasets. (A–C) The volcano plots visualize the differentially expressed genes in GSE36895, GSE53757 and GSE66272, respectively. The red nodes represent upregulated genes. The green nodes represent downregulated genes. (D–E) Common differentially expressed genes in three datasets.
Weighted co-expression network construction and key modules identification
The input dataset for WGCNA construction consist of the common 1387 genes and 26 ccRCC samples with pathological stage and grade in GSE66272 (Supplementary Figure 2A). “WGCNA” package was used in R, after quality assessment for expression matrix of GSE66272, power of β = 8 (scale free R2 = 0.9) was selected to ensure a scale-free network (Supplementary Figure 2B–2E). Then we set MEDissThres as 0.25 to merge similar modules, and a total of 7 modules were identified (Figure 2A–2B). Blue module contained 247 genes, brown module contained 234 genes, green module contained 177 genes, red module contained 93 genes, turquoise module contained 301 genes, yellow module contained 187 genes, and 148 genes could not be included in any modules were put into the gray module, which was reserved for genes identified as not co-expressed. Genes in grey module were removed in the subsequent analysis.
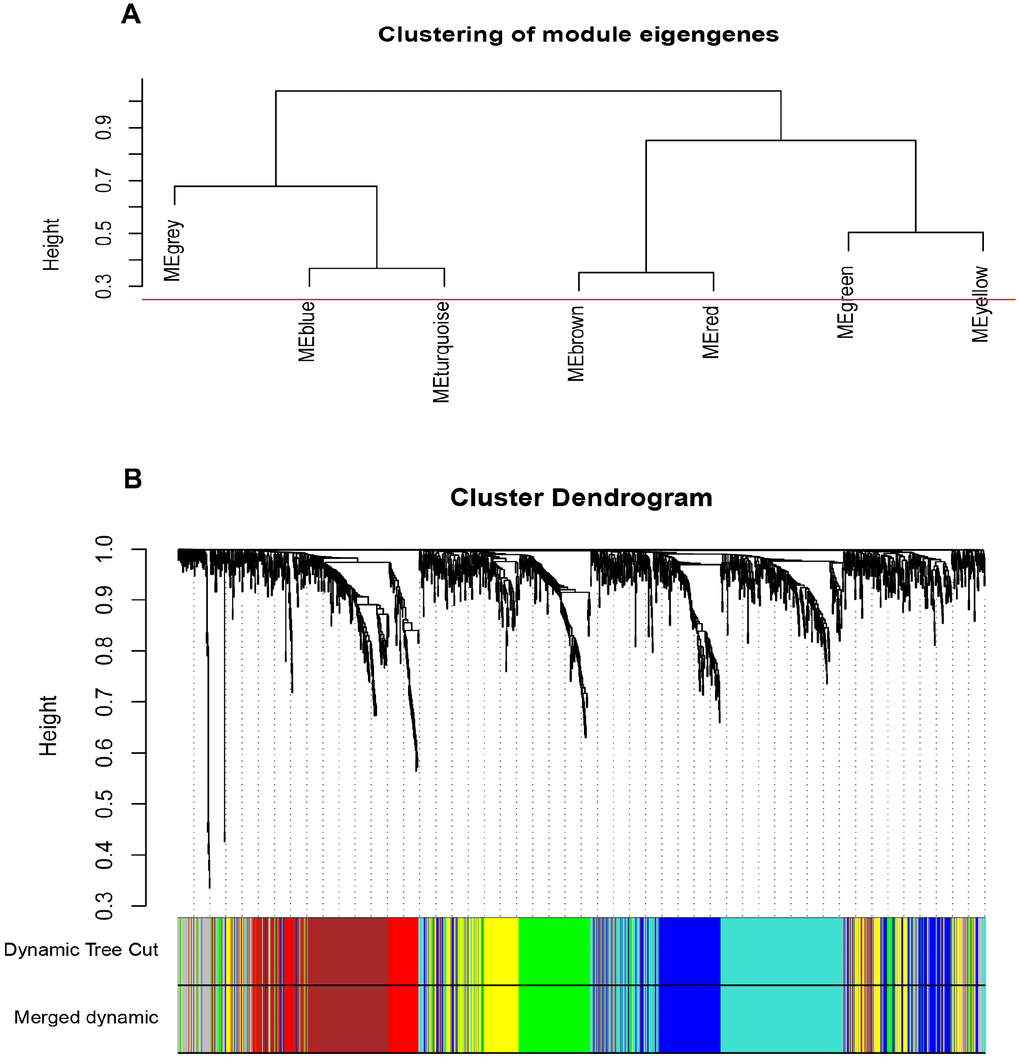
Figure 2. Construction of WGCNA co-expression modules. (A) The cluster dendrogram of module eigengenes. (B) The cluster dendrogram of the common differentially expressed genes in GSE66272. Each branch in the figure represents one gene, and every color below represents one co-expression module.
Interaction relationship of modules and identification of key modules
The network heatmap was performed to analyze the interaction relationship of 7 modules (Figure 3A). The results showed that each module was independent of each other, which indicated a high-scale independence degree among these modules and distinct independence of genes expression in each module. Then we calculated eigengenes of all modules and clustered them based on their correlation. Module eigengene dendrogram showed that the 6 modules were mainly divided into two clusters, and eigengene network heatmap demonstrated similar results (Figure 3B). Furthermore, the ME of the blue module showed the blue module was significantly associated with ccRCC tumor stage and grade compared with other modules (Figure 3C). Therefore, we selected the blue module for subsequent analysis, and identify the relevance between blue module and the clinical features with great biological significance (Supplementary Table 5).
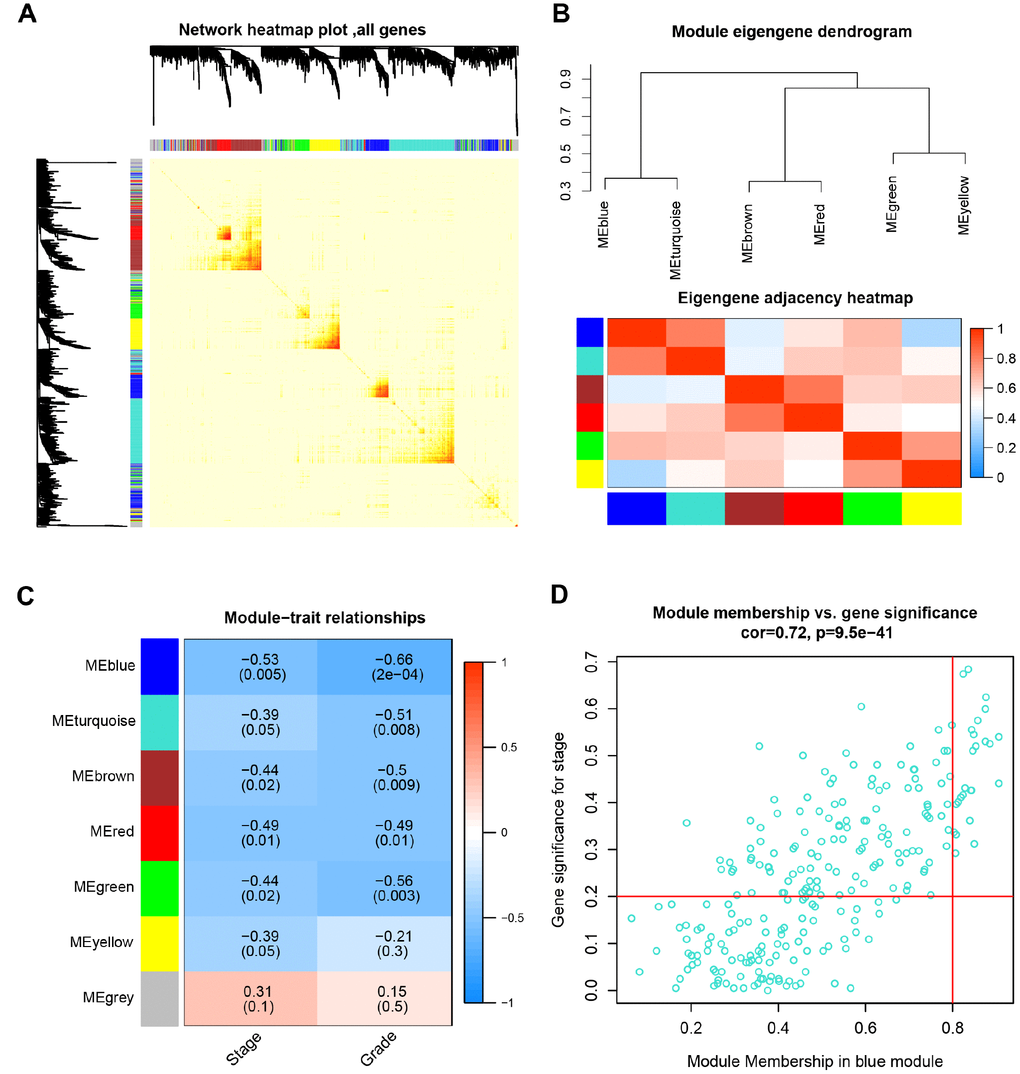
Figure 3. Identification of modules associated with the clinical traits. (A) Interaction relationship analysis of co-expression genes. Different colors of horizontal axis and vertical axis represent different modules. The brightness of yellow in the middle represents the degree of connectivity of different modules. There was no significant difference in interactions among different modules, indicating a high-scale independence degree among these modules. (B) Module eigengene dendrogram and eigengene network heatmap summarize the modules yielded in the clustering analysis. (C) Heatmap of the correlation between module eigengenes and pathological stage and grade. The blue module was significantly correlated with stage and grade. (D) Scatter plot of module eigengenes in blue module.
Functional annotation and KEGG pathway enrichment of blue modules
Gene ontology analysis and KEGG pathway enrichment were performed for the above blue module to explore potential biological processes associated with ccRCC. Biological process of gene ontology analysis showed genes in the blue module were mainly associated with cell division, cell proliferation, cell cycle and metabolic related pathway (Figure 4A). The result of KEGG pathway enrichment was showed in Figure 4B. The most significant pathway was cell cycle, the other significant pathways included glycolysis/gluconeogenesis, fructose and mannose metabolism, starch and sucrose metabolism, arachidonic acid metabolism, p53 signaling pathway, aldosterone-regulated sodium reabsorption, carbon metabolism, glutathione metabolism and insulin signaling pathway.
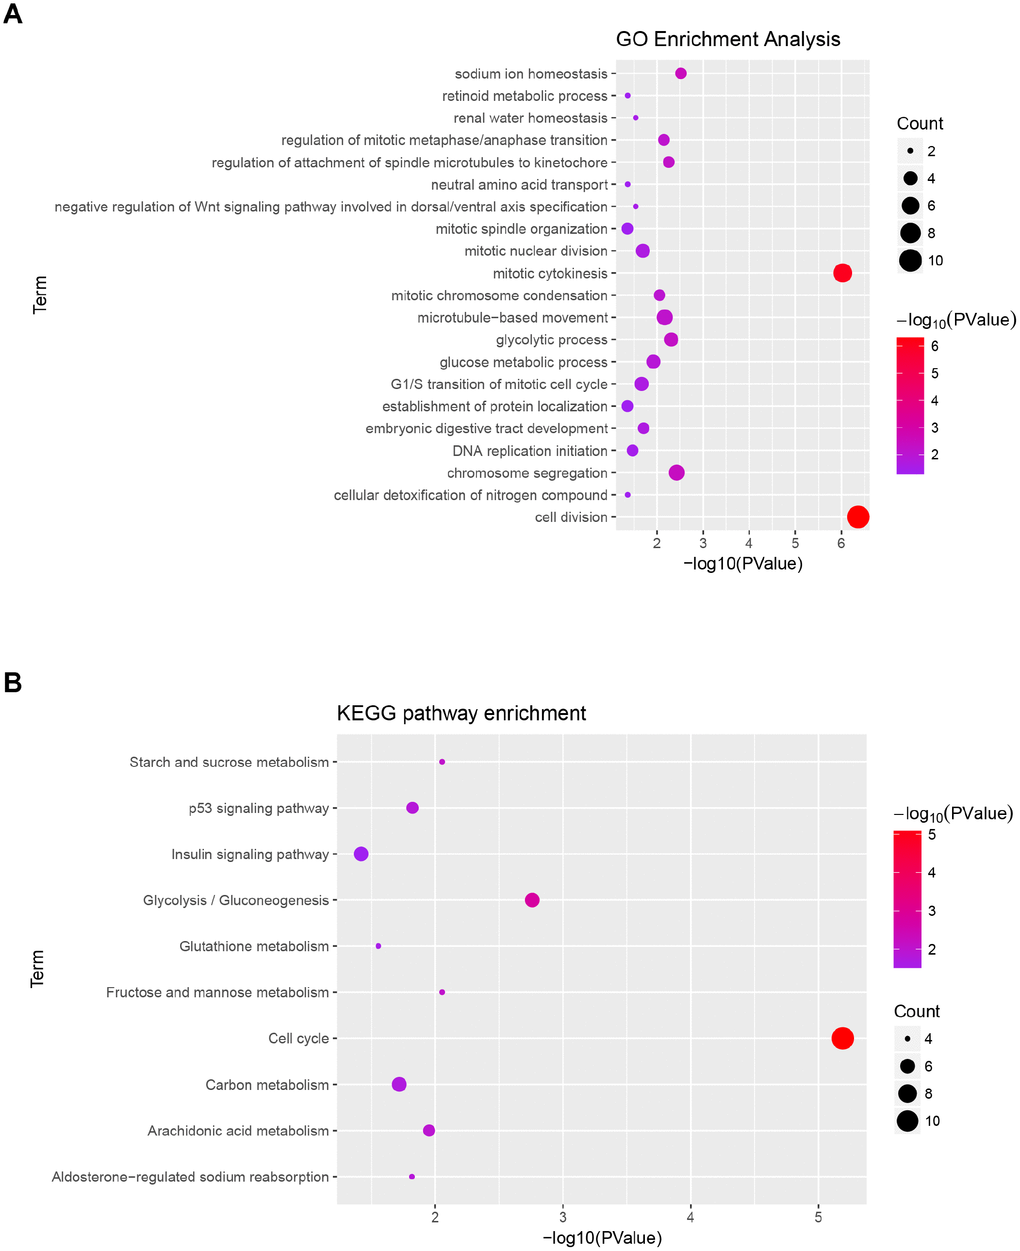
Figure 4. Functional enrichment analysis of blue module. (A) GO analysis of all genes in blue module. (B) KEGG pathway analysis of all genes in blue module.
Hub genes detection and validation
Based on the criteria that cor.geneModuleMembership > 0.8 and cor.geneTraitSignificance > 0.2, 25 genes with the high connectivity in blue module were screened as hub genes (Figure 3D). Then 25 hub genes were validated using ccRCC data of GEPIA database. Among them, PTTG1, RRM2, TOP2A, UHRF1, CEP55, BIRC5, UBE2C, FOXM1 and CDC20 were negatively associated with the overall survival and disease free survival of ccRCC patients (Figures 5, 6). Moreover, based on the GEPIA database and Oncomine database, the expression levels of these 9 genes were significantly higher in ccRCC tumor tissues, compared with paracancerous normal tissues (Figure 7 and Supplementary Figure 3). In addition, based on individual cancer stage analysis, the expression of these 9 genes were significantly upregulated in the advanced tumor stages (Supplementary Figure 4). The protein expression levels of these 9 genes were significantly higher in tumor tissues compared with paracancerous normal tissues based on the Human Protein Atlas database (Supplementary Figure 5). A ROC curve was generated to verify the diagnostic performance of these 9 genes based on the TCGA database. The AUC showed that PTTG1, RRM2, TOP2A, UHRF1, CEP55, BIRC5, UBE2C, FOXM1 and CDC20 indicated excellent diagnostic efficiency for tumor and normal tissues (Figure 8). To further assess whether it can provide the favorable prognostic value based on these 9 gene expression levels, the multivariate Cox regression analysis was performed. The results in Table 1 showed that the risk score base on these 9 genes signature was a clinically independent prognostic factor for ccRCC patients.
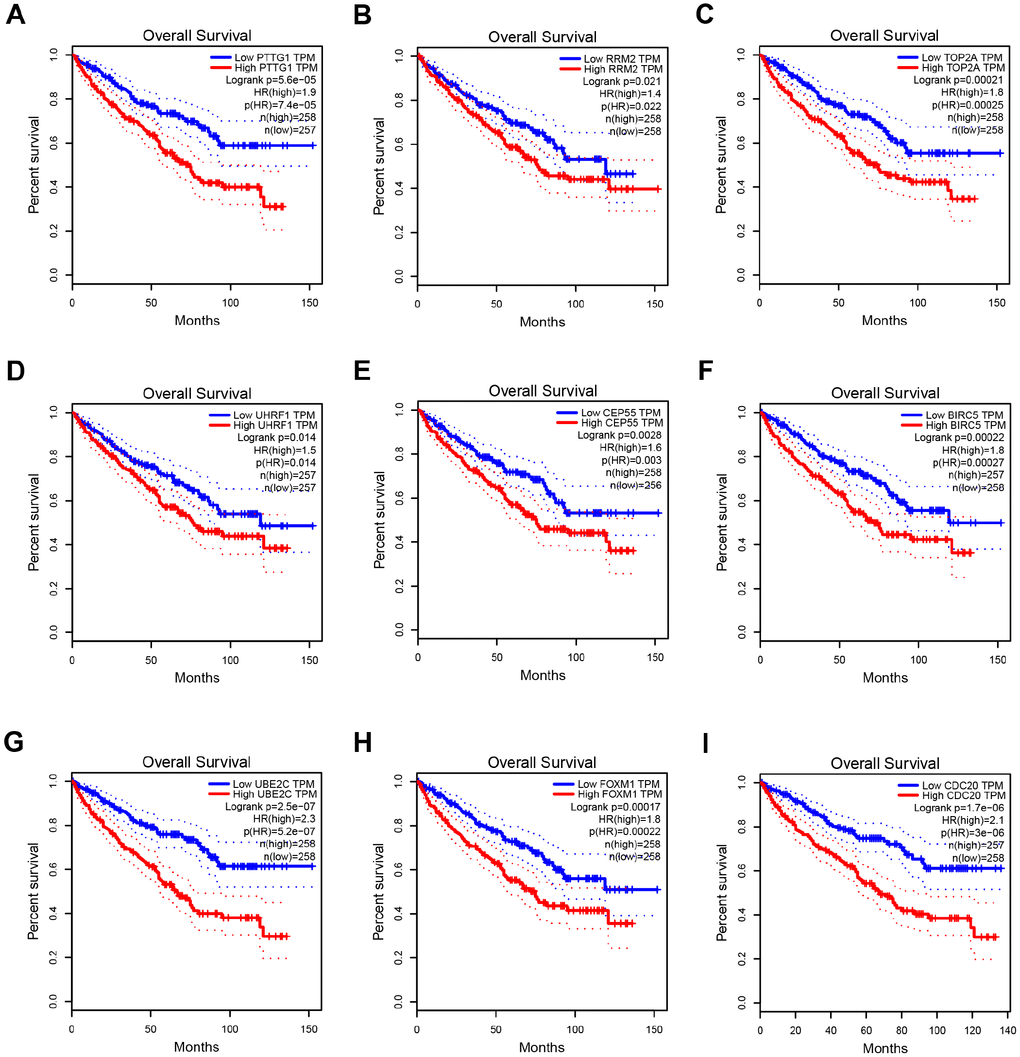
Figure 5. Overall survival analysis of 9 key genes in ccRCC (based on TCGA data in GEPIA). (A–I) Expression levels of PTTG1, RRM2, TOP2A, UHRF1, CEP55, BIRC5, UBE2C, FOXM1 and CDC20 are significantly related to the overall survival of patients with ccRCC (P < 0.05).
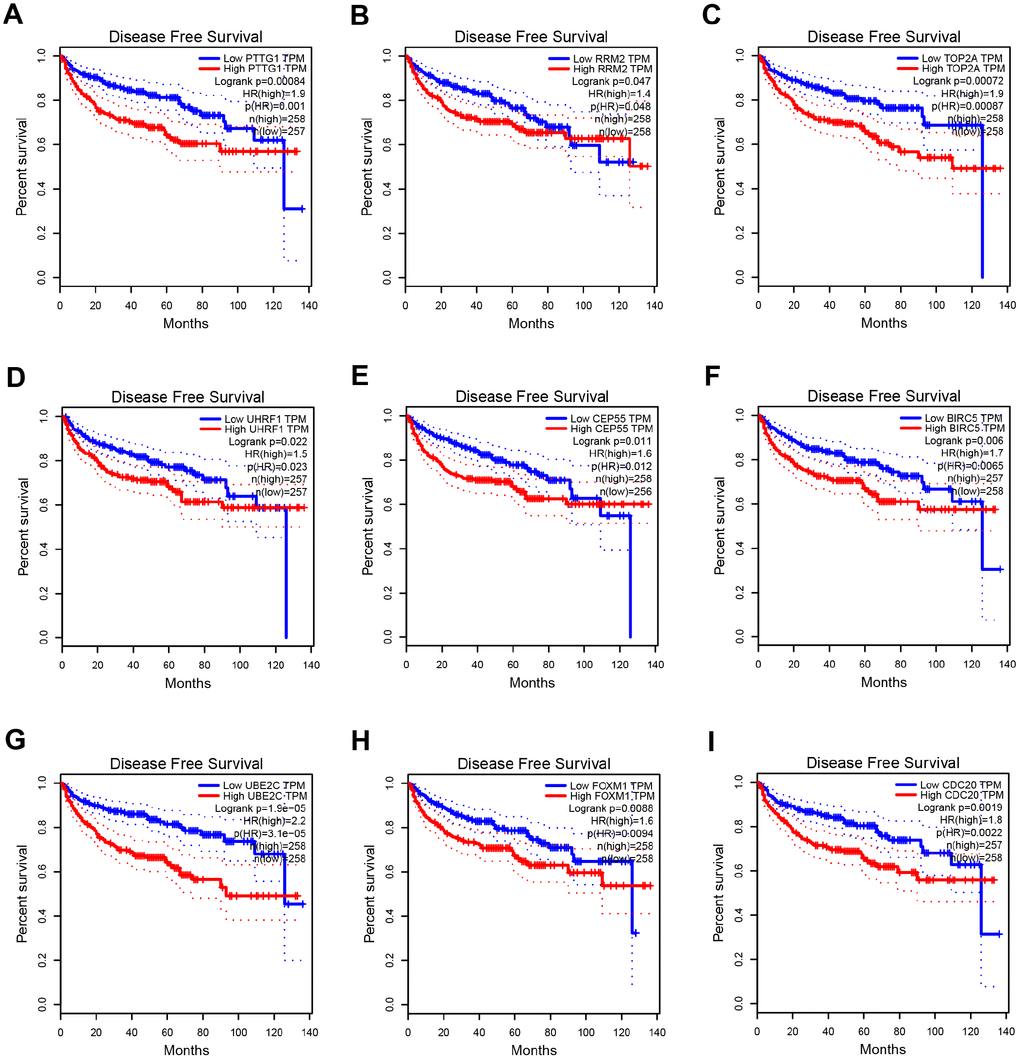
Figure 6. Disease free survival analysis of 9 key genes in ccRCC (based on TCGA data in GEPIA). (A–I) Expression levels of PTTG1, RRM2, TOP2A, UHRF1, CEP55, BIRC5, UBE2C, FOXM1 and CDC20 are significantly related to the disease free survival of patients with ccRCC (P < 0.05).
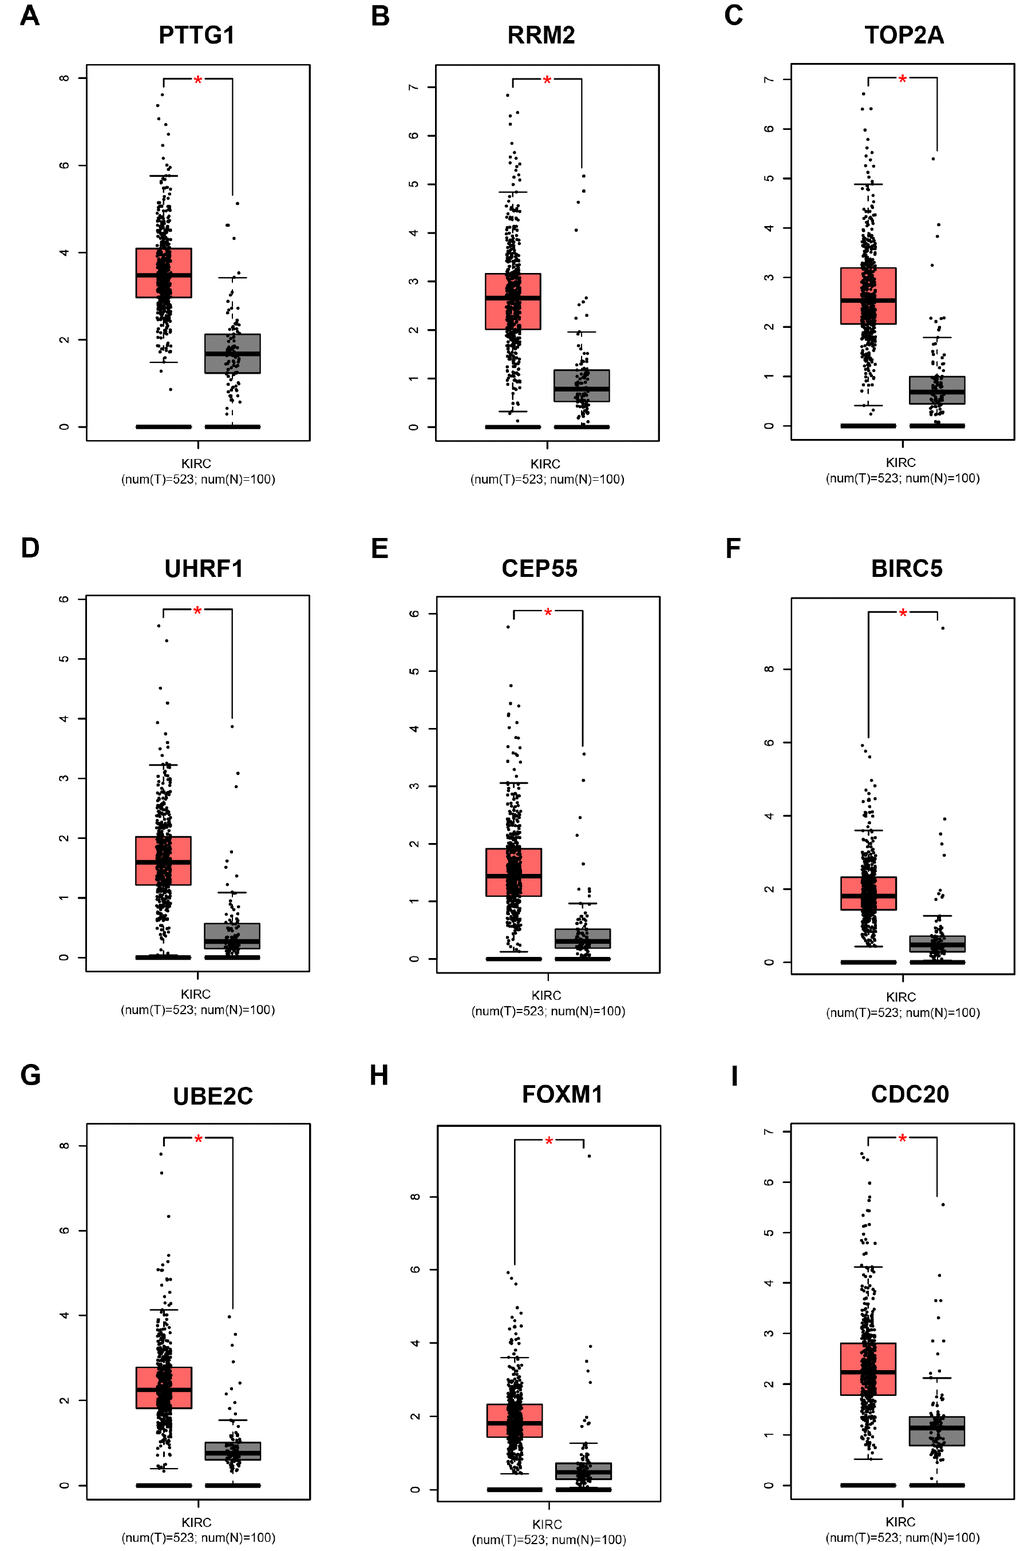
Figure 7. Validation of the gene expression levels of PTTG1, RRM2, TOP2A, UHRF1, CEP55, BIRC5, UBE2C, FOXM1 and CDC20 between normal kidney and ccRCC tissues in GEPIA database. (A–I) PTTG1, RRM2, TOP2A, UHRF1, CEP55, BIRC5, UBE2C, FOXM1 and CDC20 are significantly upregulated in ccRCC compared with normal tissues (P < 0.01). The red * represents P < 0.01.
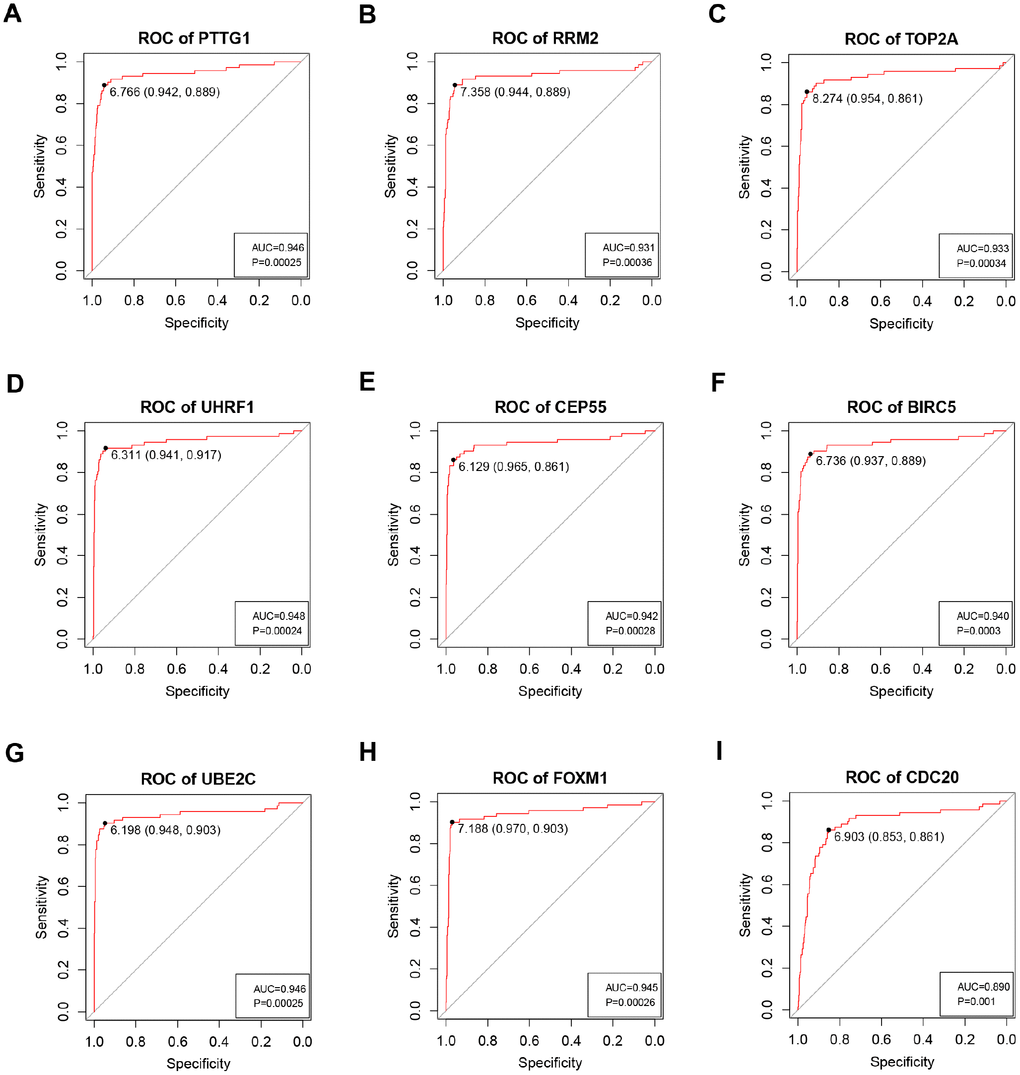
Figure 8. ROC curve analysis of 9 key genes diagnosis. Receiver operating characteristic (ROC) curves and area under the curve (AUC) statistics are used to evaluate the capacity to discriminate ccRCC from normal controls with excellent specificity and sensitivity in TCGA dataset. (A) PTTG1, (B) RRM2, (C) TOP2A, (D) UHRF1, (E) CEP55, (F) BIRC5, (G) UBE2C, (H) FOXM1, (I) CDC20.
Table 1. Multivariate Cox regression analysis of potential prognostic factors for ccRCC patients.
| Variables | Overall survival | Disease free survival | ||||
| HR | 95%CI of HR | P | HR | 95%CI of HR | P | |
| Risk score | 1.26 | 1.10-1.43 | 0.00054 | 1.18 | 1.01-1.39 | 0.038 |
| Age | 1.50 | 1.10-2.05 | 0.01 | 1.14 | 0.78-1.66 | 0.50 |
| Gender | 1.18 | 0.85-1.63 | 0.32 | 0.80 | 0.54-1.21 | 0.29 |
| Grade | 1.37 | 1.08-1.73 | 0.0094 | 1.67 | 1.27-2.20 | 0.0002 |
| Stage | 1.60 | 1.37-1.86 | 1.76e-09 | 2.29 | 1.90-2.77 | 2e-16 |
Gene set enrichment analysis (GSEA)
GSEA was performed to explore biological function of 9 hub genes. We seted the cut-off criteria as gene size ≥ 10, FDR < 0.05, and |enrichment score (ES)| > 0.65, the results revealed that high expression samples in all 9 key genes were enriched in cell cycle pathway (Supplementary Figure 6).
Genetical alteration of hub genes
The alteration statuses of 9 key genes were analyzed using TCGA ccRCC patients’ data of cBioPortal database. The 9 hub genes altered in 118 (26%) of 446 ccRCC patients (Figure 9B), and the frequency of alteration of each hub gene was shown in Figure 9A. PTTG1 and FOXM1 altered most (16% and 8%, respectively), amplification and mRNA upregulation were the main type. Figure 9C showed the relationship of the 9 genes and the other 50 most frequently altered neighbor genes. FOXM1, BIRC5, CDC20 and UBE2C were significantly important in the network.
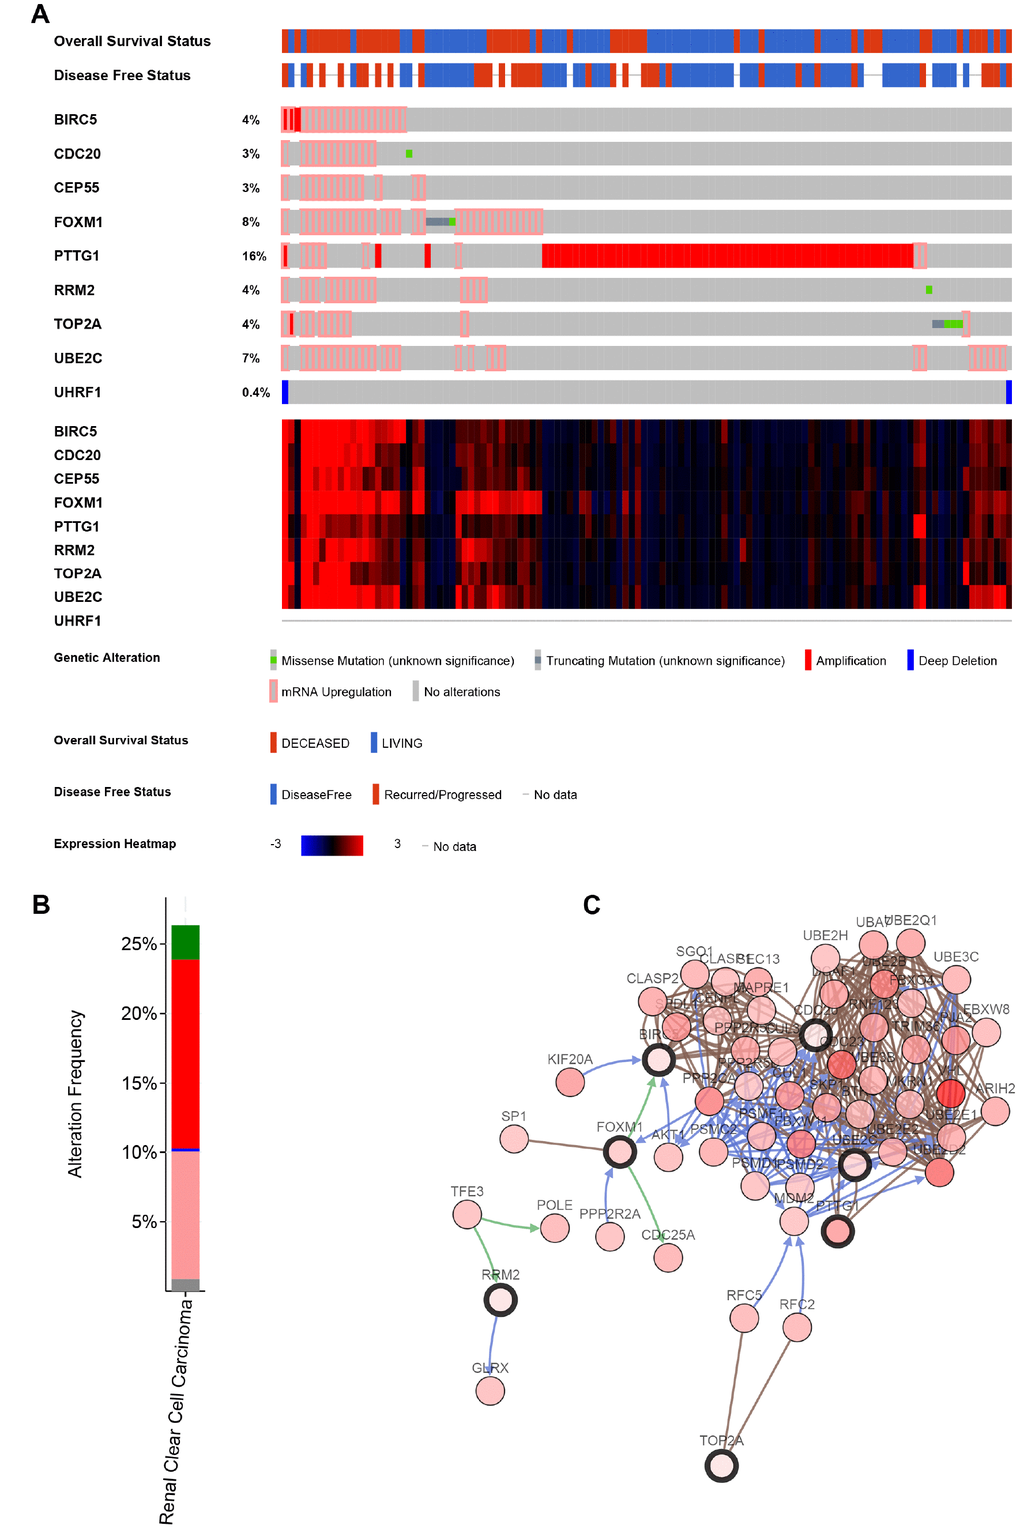
Figure 9. Genetic alterations associated with 9 key genes. (A) A visual summary of Genetic alterations (data from ccRCC in TCGA, provisional) shows the genetic alteration of 9 key genes which were altered in 118 (26%) of 446 ccRCC patients. (B) The total alteration frequency of 9 key genes is illustrated. (C) The network contains 59 nodes, including 9 key genes and the 50 most frequently altered neighbor genes. Relationship of 9 key genes is also illustrated.
Discussion
ccRCC is a heterogeneous tumor. The occurrence and progression of ccRCC are the comprehensive results activation of various oncogenes and inactivation of various tumor suppressor genes. In the present study, we used comprehensive bioinformatics analysis to identify 9 key genes associated with progression and prognosis of ccRCC patients, and select several new small molecule drugs that have the potential to treat ccRCC.
The 9 key genes consist of BIRC5, CDC20, CEP55, FOXM1, PTTG1, RRM2, TOP2A, UBE2C and UHRF1. They were all oncogenes, and associated with progression and prognosis of ccRCC patients. Few of them were identified as biomarkers in clear cell renal cell carcinoma. BIRC5 (survivin) is a member of the IAPs family. It can suppress apoptosis and regulate cell proliferation. BIRC5 overexpression has been reported in various malignancies, and it was a prognostic marker in renal cell carcinoma [5–7]. Two meta-analysis suggested that high survivin expression was associated with poor prognosis and more advanced pathological stage, and it could be used as a biomarker for disease management [8, 9]. CDC20 is one of the cell cycle related proteins. It was high expressed in most malignant tumor tissues and played an oncogenic role in tumorigenesis and tumor progression. Wu et al. reported that CDC20 expression was an independent prognostic factor in colorectal cancer and can serve as a potential prognostic biomarker [10]. Gao et al. also found that the growth and invasion of osteosarcoma cells was restrained by inhibiting CDC20 expression [11]. CEP55 is a member of the coiled-coil protein family, its main function is to anchor microtubule-associated proteins, participate in spindle formation, and regulate cell proliferation [12]. CEP55 is expressed in normal tissues and tumor cells, and is coupled with centrosomes and intermediates in the cell cycle, and plays a role in regulating cell cycle after phosphorylation. It has been found that CEP55 overexpression is significantly associated with tumor stage, invasiveness, and tumor metastasis of many malignant tumors [13–15]. FOXM1 is a transcription factor. It plays an important role in the regulation of multiple biological processes, including cell proliferation, cell cycle progression, cell differentiation, DNA damage Repair, tissue homeostasis, angiogenesis and apoptosis. Some research results indicated that FOXM1 plays a major role in tumorigenesis, Tan et al. found that FOXM1 was a specific marker in triple-negative breast cancer [16]. Breyer et al. identified that FOXM1 expression was associated with advanced clinical and pathological feature in bladder cancer [17]. PTTG1 is an oncogene which is closely associated to cell proliferation, differentiation and various signal transduction pathways. PTTG1 can directly induce carcinogenesis by cell transformation, activating proto-oncogenes and growth factors [18]. RRM2 is a key enzyme in DNA synthesis and repair pathways, and high expression of RRM2 is relative to tumor angiogenesis, invasion and metastasis [19, 20]. Previous literature reported that RRM2 promoted tumorigenesis and progression of pancreatic cancer, lung cancer, gastric cancer, ovarian cancer, bladder cancer and other tumors [21–24], TOP2A gene encoded a DNA topoisomerase, it is an ATP-dependent synthetase and hydrolase that plays a key role in cells and plays an important role in many cellular biological processes, such as DNA replication, chromatin condensation, chromosome segregation, and chromosome structure retention. Studies have found that high expression of TOP2A promoted the progression of breast cancer [25, 26]. UBE2C is also known as UbcH10, which is a member of the ubiquitin-coupled enzyme E2 family. It has been reported that the expression level of UBE2C is positively correlated with tumor grade and poor prognosis in the adrenal cancer, breast cancer, colon cancer, lung cancer and ovarian cancer [27–31]. UHRF1 is a newly discovered oncogene which related to cell growth. As a an important epigenetic regulator, it plays an important role in the maintenance of DNA methylation, and participates in important biological processes such as cell proliferation, cell cycle regulation, apoptosis and radiosensitivity, regulating cell cycle G1-S phase and G2-M phase transition, thereby promoting tumor progression [32].
The multivariate Cox regression results showed that these 9 key genes selected in our study may also represent candidate biomarkers for predicting prognosis of ccRCC patients. To further explore potential mechanism of 9 hub genes, we performed GSEA analysis of all 9 hub genes. The results revealed that all hub genes were significantly enriched in terms of cell cycle pathway. Several researchers had reported that Cell cycle disorder is the most important mechanism of tumors. In the regulation of the cell cycle, abnormalities of various molecules may cause tumorigenesis and progression. Thus, we might suppose that 9 hub genes played key role in the tumorigenesis and progression of ccRCC probably by regulating cell cycle pathway, which contributed to the poor prognosis of ccRCC.
In addition, we used CMap database to identify several small molecule drugs with potential therapeutic efficacy against ccRCC. Some of them in our results have been proven to have anti-cancer effects, such as TSA and trifluoperazine. TSA is a histone deacetylase (HDAC) inhibitor, which shows a potential therapeutic effect in various types of cancer cells, when combined with radiotherapy or chemotherapy. Trifluoperazine is a typical antipsychotic, but recently some researchers found that trifluoperazine could inhibit the proliferation of multiple cancer cells, such as glioblastoma, Hepatocellular Carcinoma and lung cancer [33–35]. Thus, we might consider that these identified molecule drugs could have potential to treat ccRCC. So our research may provide some potential biomarkers or molecular targets for ccRCC.
However, this study has some limitations. Firstly, this is a retrospective study, all the data of this study were obtained from publicly available database. a multicenter and prospective study is needed to evaluate the possible applications of molecular signatures to predict survival. Secondly, further studies including in vivo and in vitro experiments are needed to elucidate molecular mechanisms of key genes for clinical applications.
In conclusion, using weighted gene co-expression analysis, our study identified 9 key genes associated with progression and prognosis, which can provide the favorable prognostic value based on these 9 gene expression levels, and several candidate small molecule drugs that had the potential to treat ccRCC tumors in ccRCC tumors, which provide direction for ccRCC tumors targeted therapy.
Materials and Methods
Gene expression profiles data
Three gene expression profiles of mRNA and related clinical data of ccRCC were downloaded from Gene Expression Omnibus (GEO) database (http://www.ncbi.nlm.nih.gov/geo/) (Supplementary Table 1). GSE36895 includes 29 ccRCC tissues and 23 normal tissues, GSE53757 includes 72 ccRCC tissues and 72 normal tissues, and GSE66272 includes 26 ccRCC tissues and 26 adjacent normal tissues. Three gene expression profiles were used to screen differentially expressed genes. GSE66272 was performed to construct weighted gene co-expression networks analysis for this study. Gene sequencing data and corresponding clinical information of ccRCC were obtained from The Cancer Genome Atlas (TCGA) data portal (https://portal.gdc.cancer.gov/), which were used for validation of hub genes. A flowchart of this study was showed in Supplementary Figure 1.
Data preprocessing and differentially expressed genes (DEGs) screening
For the microarray analyses, RMA method was used for background correction of raw gene expression matrixes, then log2 transformation of expression matrixes. the “affy” R package was utilized for quantile normalization, median polish algorithm summarization [36]. Then all gene probes were mapped into gene symbols by the affymetrix annotation files. The “limma” (linear models for microarray data) R package was performed for DEGs identifying between ccRCC samples and normal kidney samples. Cut-off criteria for screening DEGs were false discovery rate (FDR) < 0.05 and |log2fold change| ≥ 1. For TCGA ccRCC data, the gene expression data were based on the RNA-sequencing technology of IlluminaHiseq. The read counts were used to represent the genes expression level. Data processing was performed as we described before [37]
Weighted co-expression network analysis
Weighted gene co-expression network were constructed by “WGCNA” R package, as previously described [38, 39]. First, sample clustering of common DEGs was performed to check if they were good genes and good samples. Second, a soft threshold power β was selected in accordance with standard scale-free networks. Third, we calculated the adjacencies between all filtered genes by the power adjacent function to Pearson correlation matrix to transform data into a topological overlap matrix (TOM), and the corresponding dissimilarity (1-TOM) was calculated. Then, According to the TOM-based dissimilarity measurement, average linkage hierarchical clustering was conducted with a minimum size of 50 for the genes dendrogram. To further analyze the module, the dissimilarity of module eigengenes was calculated. Highly similar modules were identified by clustering and then merged together with a height cut-off of 0.25.
Identification of clinically significant modules and functional annotation
The module eigengene (ME) was defined as the first principal component of a given module. It could be regarded as a representative of the gene expression profiles from a module, the ME can summarize the gene expression profiles, the correlation between ME and clinically significant trait was calculated to identify the relevant module. Gene significance (GS) was defined as the log10 transformation of the P value (GS = lgP) in the linear regression between gene expression and pathological progression, and module significance (MS) represented the average GS for all the genes in a module. In general, the module with the absolute MS ranked first among all the selected modules was considered as the one related with clinical trait. In order to explore the potential mechanism of how module genes impact correlative clinical feature, we uploaded all genes in blue module into Database for Annotation, Visualization, and Integrated Discovery (DAVID) (http://david.abcc.ncifcrf.gov/) online tool [3]. GO functional enrichment analysis and Kyoto Encyclopedia of Genes and Genomes (KEGG) pathway enrichment were performed. P value < 0.05 was set as the cutoff criteria.
Hub genes detection and validation
The genes with the maximum intramodular connectivity were defined as hub genes. Firstly, the most significant module was identified. Then, hub genes were screened according to the criteria that cor.geneModuleMembership > 0.8 and cor.geneTraitSignificance > 0.2. Further, the differential expression of hub genes in ccRCC was validated using Gene Expression Profiling Interactive Analysis (GEPIA) database, Oncomine and Human Protein Atlas database. ROC curve was performed to verify the diagnostic performance of hub genes. Kaplan-Meier survival curve of overall survival and disease free survival was used to analyze survival differences. In addition, the selected 9 hub genes were put in a multivariate Cox regression analysis. Risk score of 9 hub genes was developed based on the mRNA expression level weighted by the estimated regression coefficient in the multivariate Cox regression analysis. The risk score for each patient was calculated as follows, risk score
Genetical alteration of hub genes
The cBioPortal for Cancer Genomics (http://www.cbioportal.org/) is a large-scale cancer genomics database [40]. It provides an open platform to explore, visualize and analyze multi-dimensional cancer genomic data. Researchers can interactively explore the genetic changes of different samples, genes, and paths. This site also provides gene level graphical summaries from multi-platform, web visualization analysis and survival analysis. We used cBioPortal to explore genetic alterations connected with the 9 hub genes and their correlation with other famous genes.
Gene set enrichment analysis (GSEA)
GSEA (http://software.broadinstitute.org/gsea/index.jsp) was used to explore biological function of 9 hub genes [41]. Annotated gene sets c2.cp.kegg. v5.2.symbols.gmt was chosen as the reference gene sets. Gene size ≥ 10, FDR < 0.05, and |enrichment score (ES)| > 0.65 were set as the cut-off criteria.
Identification of candidate small molecules
Connectivity map (CMap) is a gene expression profiles database. It is constructed by team led by Todd Golub and Eric Lander [42]. Firstly, small molecule drugs were utilized to process human cells. Then, differential expressed genes after treatment were used to establish a database, which interrelated small molecule drugs, gene expression and disease. It could help researchers to quickly identify molecule drugs with high correlation with diseases, the chemical structure of molecule drugs and the possible mechanism of molecule drugs.
Supplementary Materials
Abbreviations
ccRCC: Clear cell renal cell carcinoma; CMap: Connectivity map; DAVID: Database for Annotation, Visualization, and Integrated Discovery; DEGs: Differentially expressed genes; DFS: Disease-free survival; FDR: False discovery rate; GEO: Gene expression omnibus; GO: Gene ontology; GS: Gene significance; GSEA: Gene set enrichment analysis; HDAC: Histone deacetylase; KEGG: Kyoto encyclopedia of genes and genomes; ME: Module eigengene; MS: Module significance; OS: Overall survival; TCGA: The cancer genome atlas; TOM: Topological overlap matrix; WGCNA: Weighted gene co-expression network analysis.
Acknowledgments
The excellent technical assistance of Yayun Fang and Danni Shan is gratefully acknowledged. We would like to acknowledge the KEGG database developed by Kanehisa Laboratories. We also would like to acknowledge the Oncomine, GEPIA and TCGA databases for free use.
Conflicts of Interest
The authors declare that there is no conflicts of interest.
Funding
This work was supported by grants from the Health commission of Hubei Province scientific research project (grant number WJ2019H023) and the Fundamental Research Funds for the Central Universities (grant number 2042019kf0150).
References
- 1. Bray F, Ferlay J, Soerjomataram I, Siegel RL, Torre LA, Jemal A. Global cancer statistics 2018: GLOBOCAN estimates of incidence and mortality worldwide for 36 cancers in 185 countries. CA Cancer J Clin. 2018; 68:394–424. https://doi.org/10.3322/caac.21492 [PubMed]
- 2. Ljungberg B, Bensalah K, Canfield S, Dabestani S, Hofmann F, Hora M, Kuczyk MA, Lam T, Marconi L, Merseburger AS, Mulders P, Powles T, Staehler M, et al. EAU guidelines on renal cell carcinoma: 2014 update. Eur Urol. 2015; 67:913–24. https://doi.org/10.1016/j.eururo.2015.01.005 [PubMed]
- 3. Cairns P. Renal cell carcinoma. Cancer Biomark. 2010; 9:461–73. https://doi.org/10.3233/CBM-2011-0176 [PubMed]
- 4. Vera-Badillo FE, Templeton AJ, Duran I, Ocana A, de Gouveia P, Aneja P, Knox JJ, Tannock IF, Escudier B, Amir E. Systemic therapy for non-clear cell renal cell carcinomas: a systematic review and meta-analysis. Eur Urol. 2015; 67:740–49. https://doi.org/10.1016/j.eururo.2014.05.010 [PubMed]
- 5. Sant GR, Kempuraj D, Marchand JE, Theoharides TC. The mast cell in interstitial cystitis: role in pathophysiology and pathogenesis. Urology. 2007 (Suppl); 69:34–40. https://doi.org/10.1016/j.urology.2006.08.1109 [PubMed]
- 6. Lei Y, Geng Z, Guo-Jun W, He W, Jian-Lin Y. Prognostic significance of survivin expression in renal cell cancer and its correlation with radioresistance. Mol Cell Biochem. 2010; 344:23–31. https://doi.org/10.1007/s11010-010-0525-3 [PubMed]
- 7. Mahotka C, Krieg T, Krieg A, Wenzel M, Suschek CV, Heydthausen M, Gabbert HE, Gerharz CD. Distinct in vivo expression patterns of survivin splice variants in renal cell carcinomas. Int J Cancer. 2002; 100:30–36. https://doi.org/10.1002/ijc.10450 [PubMed]
- 8. Xiong C, Liu H, Chen Z, Yu Y, Liang C. Prognostic role of survivin in renal cell carcinoma: A system review and meta-analysis. Eur J Intern Med. 2016; 33:102–07. https://doi.org/10.1016/j.ejim.2016.06.009 [PubMed]
- 9. Xie Y, Ma X, Gu L, Li H, Chen L, Li X, Gao Y, Fan Y, Zhang Y, Yao Y, Zhang X. Prognostic and Clinicopathological Significance of Survivin Expression in Renal Cell Carcinoma: A Systematic Review and Meta-Analysis. Sci Rep. 2016; 6:29794. https://doi.org/10.1038/srep29794 [PubMed]
- 10. Wu WJ, Hu KS, Wang DS, Zeng ZL, Zhang DS, Chen DL, Bai L, Xu RH. CDC20 overexpression predicts a poor prognosis for patients with colorectal cancer. J Transl Med. 2013; 11:142. https://doi.org/10.1186/1479-5876-11-142 [PubMed]
- 11. Gao Y, Zhang B, Wang Y, Shang G. Cdc20 inhibitor apcin inhibits the growth and invasion of osteosarcoma cells. Oncol Rep. 2018; 40:841–48. https://doi.org/10.3892/or.2018.6467 [PubMed]
- 12. Fabbro M, Zhou BB, Takahashi M, Sarcevic B, Lal P, Graham ME, Gabrielli BG, Robinson PJ, Nigg EA, Ono Y, Khanna KK. Cdk1/Erk2- and Plk1-dependent phosphorylation of a centrosome protein, Cep55, is required for its recruitment to midbody and cytokinesis. Dev Cell. 2005; 9:477–88. https://doi.org/10.1016/j.devcel.2005.09.003 [PubMed]
- 13. Singh PK, Srivastava AK, Rath SK, Dalela D, Goel MM, Bhatt ML. Expression and clinical significance of Centrosomal protein 55 (CEP55) in human urinary bladder transitional cell carcinoma. Immunobiology. 2015; 220:103–08. https://doi.org/10.1016/j.imbio.2014.08.014 [PubMed]
- 14. Naderi A, Teschendorff AE, Barbosa-Morais NL, Pinder SE, Green AR, Powe DG, Robertson JF, Aparicio S, Ellis IO, Brenton JD, Caldas C. A gene-expression signature to predict survival in breast cancer across independent data sets. Oncogene. 2007; 26:1507–16. https://doi.org/10.1038/sj.onc.1209920 [PubMed]
- 15. Jiang C, Zhang Y, Li Y, Lu J, Huang Q, Xu R, Feng Y, Yan S. High CEP55 expression is associated with poor prognosis in non-small-cell lung cancer. OncoTargets Ther. 2018; 11:4979–90. https://doi.org/10.2147/OTT.S165750 [PubMed]
- 16. Tan Y, Wang Q, Xie Y, Qiao X, Zhang S, Wang Y, Yang Y, Zhang B. Identification of FOXM1 as a specific marker for triple-negative breast cancer. Int J Oncol. 2019; 54:87–97. https://doi.org/10.3892/ijo.2018.4598 [PubMed]
- 17. Breyer J, Wirtz RM, Erben P, Rinaldetti S, Worst TS, Stoehr R, Eckstein M, Sikic D, Denzinger S, Burger M, Hartmann A, Otto W. FOXM1 overexpression is associated with adverse outcome and predicts response to intravesical instillation therapy in stage pT1 non-muscle-invasive bladder cancer. BJU Int. 2019; 123:187–96. https://doi.org/10.1111/bju.14525 [PubMed]
- 18. Li T, Huang H, Huang B, Huang B, Lu J. Histone acetyltransferase p300 regulates the expression of human pituitary tumor transforming gene (hPTTG). J Genet Genomics. 2009; 36:335–42. https://doi.org/10.1016/S1673-8527(08)60122-8 [PubMed]
- 19. Zhang K, Hu S, Wu J, Chen L, Lu J, Wang X, Liu X, Zhou B, Yen Y. Overexpression of RRM2 decreases thrombspondin-1 and increases VEGF production in human cancer cells in vitro and in vivo: implication of RRM2 in angiogenesis. Mol Cancer. 2009; 8:11. https://doi.org/10.1186/1476-4598-8-11 [PubMed]
- 20. Li J, Pang J, Liu Y, Zhang J, Zhang C, Shen G, Song L. Suppression of RRM2 inhibits cell proliferation, causes cell cycle arrest and promotes the apoptosis of human neuroblastoma cells and in human neuroblastoma RRM2 is suppressed following chemotherapy. Oncol Rep. 2018; 40:355–60. https://doi.org/10.3892/or.2018.6420 [PubMed]
- 21. Fujita H, Ohuchida K, Mizumoto K, Itaba S, Ito T, Nakata K, Yu J, Kayashima T, Souzaki R, Tajiri T, Manabe T, Ohtsuka T, Tanaka M. Gene expression levels as predictive markers of outcome in pancreatic cancer after gemcitabine-based adjuvant chemotherapy. Neoplasia. 2010; 12:807–17. https://doi.org/10.1593/neo.10458 [PubMed]
- 22. Souglakos J, Boukovinas I, Taron M, Mendez P, Mavroudis D, Tripaki M, Hatzidaki D, Koutsopoulos A, Stathopoulos E, Georgoulias V, Rosell R. Ribonucleotide reductase subunits M1 and M2 mRNA expression levels and clinical outcome of lung adenocarcinoma patients treated with docetaxel/gemcitabine. Br J Cancer. 2008; 98:1710–15. https://doi.org/10.1038/sj.bjc.6604344 [PubMed]
- 23. Morikawa T, Hino R, Uozaki H, Maeda D, Ushiku T, Shinozaki A, Sakatani T, Fukayama M. Expression of ribonucleotide reductase M2 subunit in gastric cancer and effects of RRM2 inhibition in vitro. Hum Pathol. 2010; 41:1742–48. https://doi.org/10.1016/j.humpath.2010.06.001 [PubMed]
- 24. Ferrandina G, Mey V, Nannizzi S, Ricciardi S, Petrillo M, Ferlini C, Danesi R, Scambia G, Del Tacca M. Expression of nucleoside transporters, deoxycitidine kinase, ribonucleotide reductase regulatory subunits, and gemcitabine catabolic enzymes in primary ovarian cancer. Cancer Chemother Pharmacol. 2010; 65:679–86. https://doi.org/10.1007/s00280-009-1073-y [PubMed]
- 25. Shigematsu H, Ozaki S, Yasui D, Yamamoto H, Zaitsu J, Taniyama D, Saitou A, Kuraoka K, Hirata T, Taniyama K. Overexpression of topoisomerase II alpha protein is a factor for poor prognosis in patients with luminal B breast cancer. Oncotarget. 2018; 9:26701–10. https://doi.org/10.18632/oncotarget.25468 [PubMed]
- 26. Hall SR, Toulany J, Bennett LG, Martinez-Farina CF, Robertson AW, Jakeman DL, Goralski KB. Jadomycins Inhibit Type II Topoisomerases and Promote DNA Damage and Apoptosis in Multidrug-Resistant Triple-Negative Breast Cancer Cells. J Pharmacol Exp Ther. 2017; 363:196–210. https://doi.org/10.1124/jpet.117.241125 [PubMed]
- 27. van Ree JH, Jeganathan KB, Malureanu L, van Deursen JM. Overexpression of the E2 ubiquitin-conjugating enzyme UbcH10 causes chromosome missegregation and tumor formation. J Cell Biol. 2010; 188:83–100. https://doi.org/10.1083/jcb.200906147 [PubMed]
- 28. Bavi P, Uddin S, Ahmed M, Jehan Z, Bu R, Abubaker J, Sultana M, Al-Sanea N, Abduljabbar A, Ashari LH, Alhomoud S, Al-Dayel F, Prabhakaran S, et al. Bortezomib stabilizes mitotic cyclins and prevents cell cycle progression via inhibition of UBE2C in colorectal carcinoma. Am J Pathol. 2011; 178:2109–20. https://doi.org/10.1016/j.ajpath.2011.01.034 [PubMed]
- 29. Mo CH, Gao L, Zhu XF, Wei KL, Zeng JJ, Chen G, Feng ZB. The clinicopathological significance of UBE2C in breast cancer: a study based on immunohistochemistry, microarray and RNA-sequencing data. Cancer Cell Int. 2017; 17:83. https://doi.org/10.1186/s12935-017-0455-1 [PubMed]
- 30. Zhang Z, Liu P, Wang J, Gong T, Zhang F, Ma J, Han N. Ubiquitin-conjugating enzyme E2C regulates apoptosis-dependent tumor progression of non-small cell lung cancer via ERK pathway. Med Oncol. 2015; 32:149. https://doi.org/10.1007/s12032-015-0609-8 [PubMed]
- 31. Berlingieri MT, Pallante P, Guida M, Nappi C, Masciullo V, Scambia G, Ferraro A, Leone V, Sboner A, Barbareschi M, Ferro A, Troncone G, Fusco A. UbcH10 expression may be a useful tool in the prognosis of ovarian carcinomas. Oncogene. 2007; 26:2136–40. https://doi.org/10.1038/sj.onc.1210010 [PubMed]
- 32. Tien AL, Senbanerjee S, Kulkarni A, Mudbhary R, Goudreau B, Ganesan S, Sadler KC, Ukomadu C. UHRF1 depletion causes a G2/M arrest, activation of DNA damage response and apoptosis. Biochem J. 2011; 435:175–85. https://doi.org/10.1042/BJ20100840 [PubMed]
- 33. Pinheiro T, Otrocka M, Seashore-Ludlow B, Rraklli V, Holmberg J, Forsberg-Nilsson K, Simon A, Kirkham M. A chemical screen identifies trifluoperazine as an inhibitor of glioblastoma growth. Biochem Biophys Res Commun. 2017; 494:477–83. https://doi.org/10.1016/j.bbrc.2017.10.106 [PubMed]
- 34. Jiang J, Huang Z, Chen X, Luo R, Cai H, Wang H, Zhang H, Sun T, Zhang Y. Trifluoperazine Activates FOXO1-Related Signals to Inhibit Tumor Growth in Hepatocellular Carcinoma. DNA Cell Biol. 2017; 36:813–21. https://doi.org/10.1089/dna.2017.3790 [PubMed]
- 35. Yeh CT, Wu AT, Chang PM, Chen KY, Yang CN, Yang SC, Ho CC, Chen CC, Kuo YL, Lee PY, Liu YW, Yen CC, Hsiao M, et al. Trifluoperazine, an antipsychotic agent, inhibits cancer stem cell growth and overcomes drug resistance of lung cancer. Am J Respir Crit Care Med. 2012; 186:1180–88. https://doi.org/10.1164/rccm.201207-1180OC [PubMed]
- 36. Gautier L, Cope L, Bolstad BM, Irizarry RA. affy—analysis of Affymetrix GeneChip data at the probe level. Bioinformatics. 2004; 20:307–15. https://doi.org/10.1093/bioinformatics/btg405 [PubMed]
- 37. Luo Y, Chen L, Wang G, Xiao Y, Ju L, Wang X. Identification of a three-miRNA signature as a novel potential prognostic biomarker in patients with clear cell renal cell carcinoma. J Cell Biochem. 2019; 120:13751–64. https://doi.org/10.1002/jcb.28648 [PubMed]
- 38. Chen L, Yuan L, Wang Y, Wang G, Zhu Y, Cao R, Qian G, Xie C, Liu X, Xiao Y, Wang X. Co-expression network analysis identified FCER1G in association with progression and prognosis in human clear cell renal cell carcinoma. Int J Biol Sci. 2017; 13:1361–72. https://doi.org/10.7150/ijbs.21657 [PubMed]
- 39. Langfelder P, Horvath S. WGCNA: an R package for weighted correlation network analysis. BMC Bioinformatics. 2008; 9:559. https://doi.org/10.1186/1471-2105-9-559 [PubMed]
- 40. Cerami E, Gao J, Dogrusoz U, Gross BE, Sumer SO, Aksoy BA, Jacobsen A, Byrne CJ, Heuer ML, Larsson E, Antipin Y, Reva B, Goldberg AP, et al. The cBio cancer genomics portal: an open platform for exploring multidimensional cancer genomics data. Cancer Discov. 2012; 2:401–04. https://doi.org/10.1158/2159-8290.CD-12-0095 [PubMed]
- 41. Subramanian A, Tamayo P, Mootha VK, Mukherjee S, Ebert BL, Gillette MA, Paulovich A, Pomeroy SL, Golub TR, Lander ES, Mesirov JP. Gene set enrichment analysis: a knowledge-based approach for interpreting genome-wide expression profiles. Proc Natl Acad Sci USA. 2005; 102:15545–50. https://doi.org/10.1073/pnas.0506580102 [PubMed]
- 42. Lamb J, Crawford ED, Peck D, Modell JW, Blat IC, Wrobel MJ, Lerner J, Brunet JP, Subramanian A, Ross KN, Reich M, Hieronymus H, Wei G, et al. The Connectivity Map: using gene-expression signatures to connect small molecules, genes, and disease. Science. 2006; 313:1929–35. https://doi.org/10.1126/science.1132939 [PubMed]