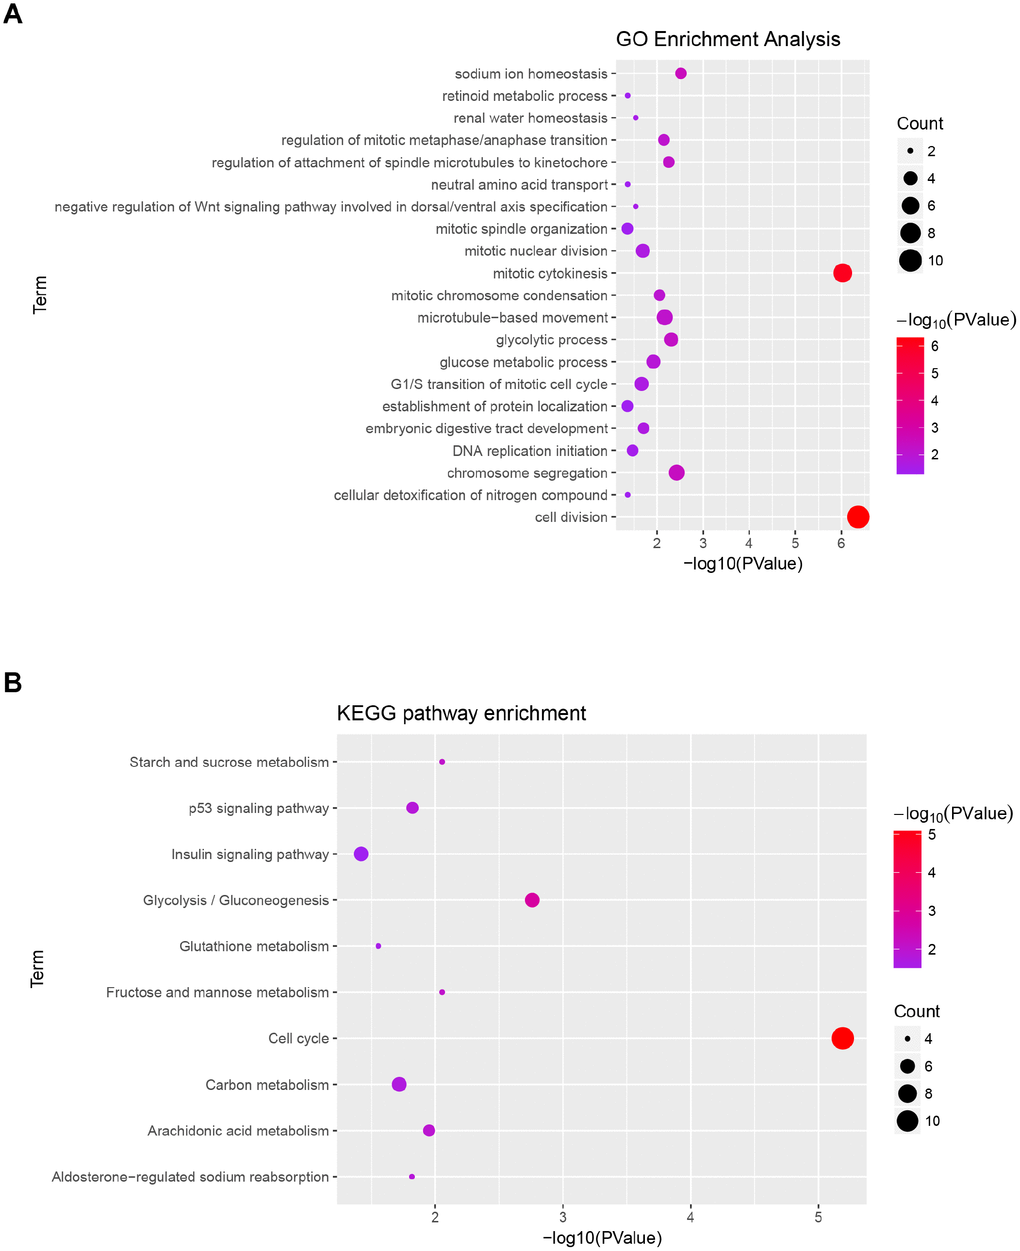
Figure 4.Functional enrichment analysis of blue module. (A) GO analysis of all genes in blue module. (B) KEGG pathway analysis of all genes in blue module.
Figure 4 — Identification of 9 key genes and small molecule drugs in clear cell renal cell carcinoma | Aging