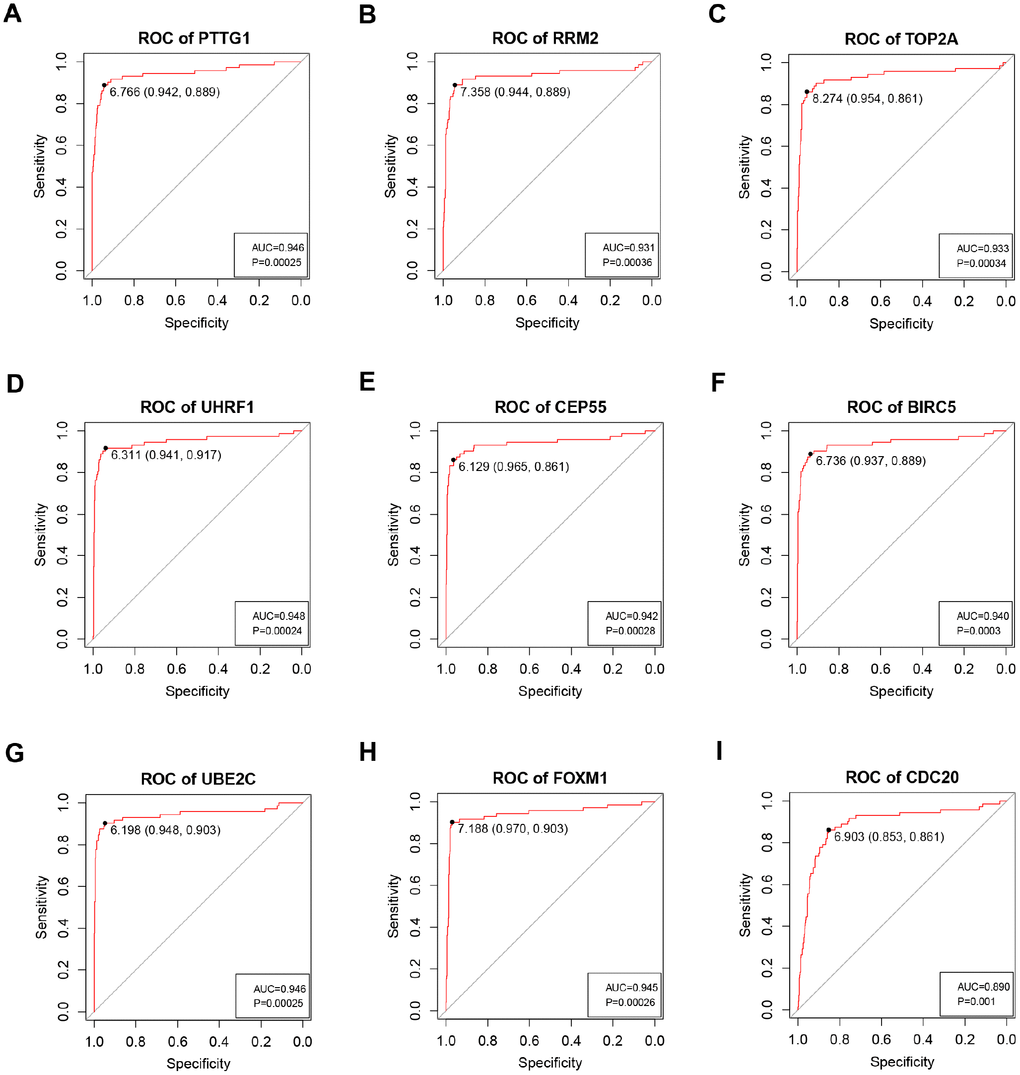
Figure 8.ROC curve analysis of 9 key genes diagnosis. Receiver operating characteristic (ROC) curves and area under the curve (AUC) statistics are used to evaluate the capacity to discriminate ccRCC from normal controls with excellent specificity and sensitivity in TCGA dataset. (A) PTTG1, (B) RRM2, (C) TOP2A, (D) UHRF1, (E) CEP55, (F) BIRC5, (G) UBE2C, (H) FOXM1, (I) CDC20.