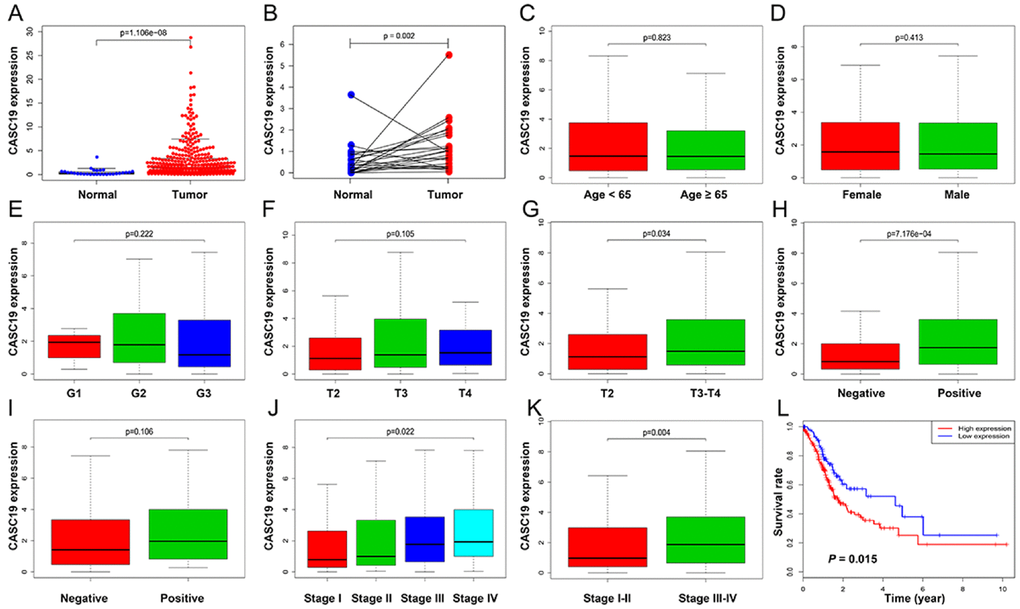
Figure 4.Correlation between CASC19 expression and clinicopathologic parameters. (A) CASC19 expression comparison between AGC tissues and non-tumor tissues. (B) CASC19 expression comparison between AGC tissues and paired non-tumor tissues. (C) CASC19 expression comparison between different age groups. (D) CASC19 expression comparison between genders. (E) CASC19 expression comparison based on tumor histology. (F) and (G) CASC19 expression comparison between different pathologic T stages. (H) CASC19 expression based on metastatic LN status. (I) CASC19 expression based on distant metastasis status. (J) and (K) CASC19 expression comparison between different pathologic TNM stages. (L) Kaplan–Meier survival curves. AGC patients with high CASC19 expression (≥ 0.57) had significantly worse prognosis than those with low CASC19 expression (< 0.57) for overall survival.