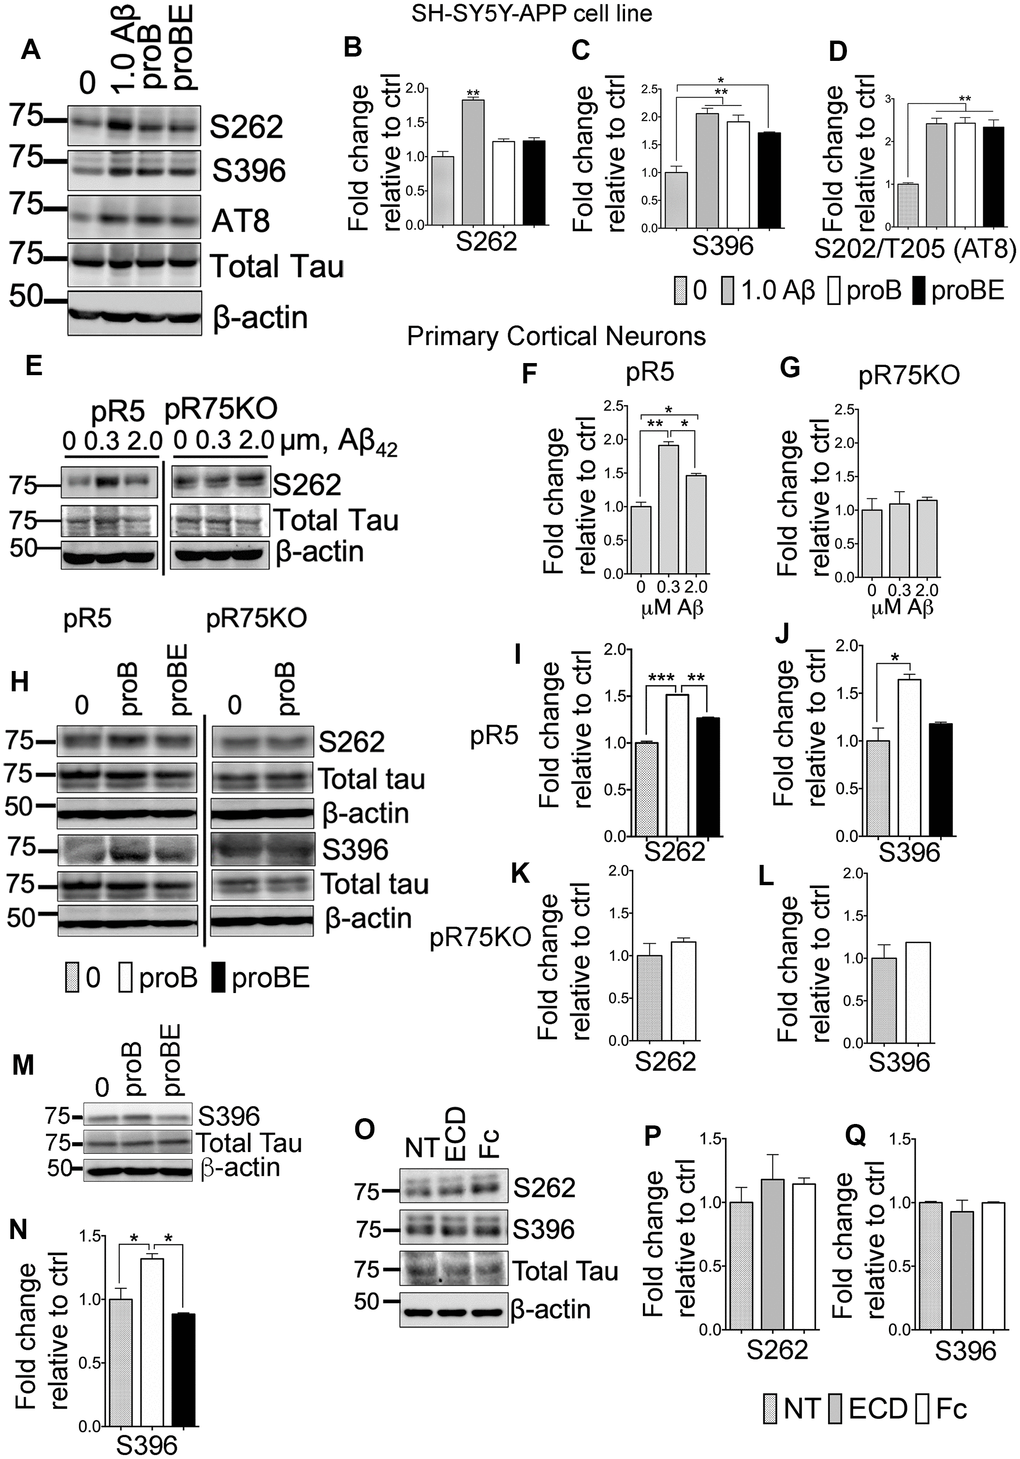
Figure 5.p75NTR ligands, Aβ and pro-BDNF, induced Tau hyperphosphorylation of neurons in vitro. (A) Protein blots of phosphorylated human Tau at sites S262, S396 and S202/T205 (AT8) in SH-SY5Y-APP cell. Treatments were control (0), Aβ42 (1.0 μM), proBDNF (30 ng/mL, proB), and proBDNF (30 ng/mL,) with p75ECD-Fc (10 μg/mL) (proBE). Protein band intensity quantification of phosphorylated human Tau at S262 (B), S396 (C) and S202/T205 (AT8) (D) in SH-SY5Y-APP cell line normalised with total human Tau and expressed as fold change relative to non-treated control (0). Data are represented as the mean ± SEM, n=3. (E) Protein blots of phosphorylated human Tau at site S262 in primary cortical neurons from pR5 and pR75KO mice treated with different concentrations of Aβ42 (0, 0.3, 2.0 μM). Protein band intensity quantification of phosphorylated human Tau at S262 in neurons from pR5 (F) and pR75KO (G) mice normalized with total human Tau and expressed as fold change relative to non-treated control (0). Data are represented as the mean ± SEM. Experiment was done in 3 replicates, each replicate has n=12 animals. (H) Protein blots of phosphorylated human Tau at sites S262 and S396 in primary cortical neurons frompR5 and pR75KO mice treated with proB and proBE. Protein band intensity quantification of phosphorylated human Tau at S262 and S396 in neurons from pR5 (I, J) and pR75KO (K, L) mice normalized with total human Tau and expressed as fold change relative to non-treated control (0) Data are represented as the mean ± SEM. Experiment was done in 3 replicates, each replicate has n=12 animals. (M) Protein blots of phosphorylated human Tau at site S396 in primary cortical neurons from Wt mice treated with proB and proBE. (N) Protein band intensity quantification of phosphorylated human Tau S396 in Wt mice normalized with total human Tau and expressed as fold change relative to non-treated control (0) Data are represented as the mean ± SEM. Experiment was done in 3 replicates, each replicate has n=12 animals. (O) Protein blots of phosphorylated human Tau at sites S262 and S396 in primary cortical neurons of Wt mice treated with p75ECD-Fc (10 μg/mL, ECD) and Human-Fc (10 μg/mL). Protein band intensity quantification of phosphorylated human Tau at sites S262 (P) and S396 (Q) in Wt mice normalized with total human Tau and expressed as fold change relative to non-treated control (0). Data are represented as the mean ± SEM, n=6 animals. All statistical comparisons were performed using one-way ANOVA and Tukey’s test. Statistical significance: Statistical significance: *P<0.05, **P<0.01, ***P<0.001, ****P<0.0001.