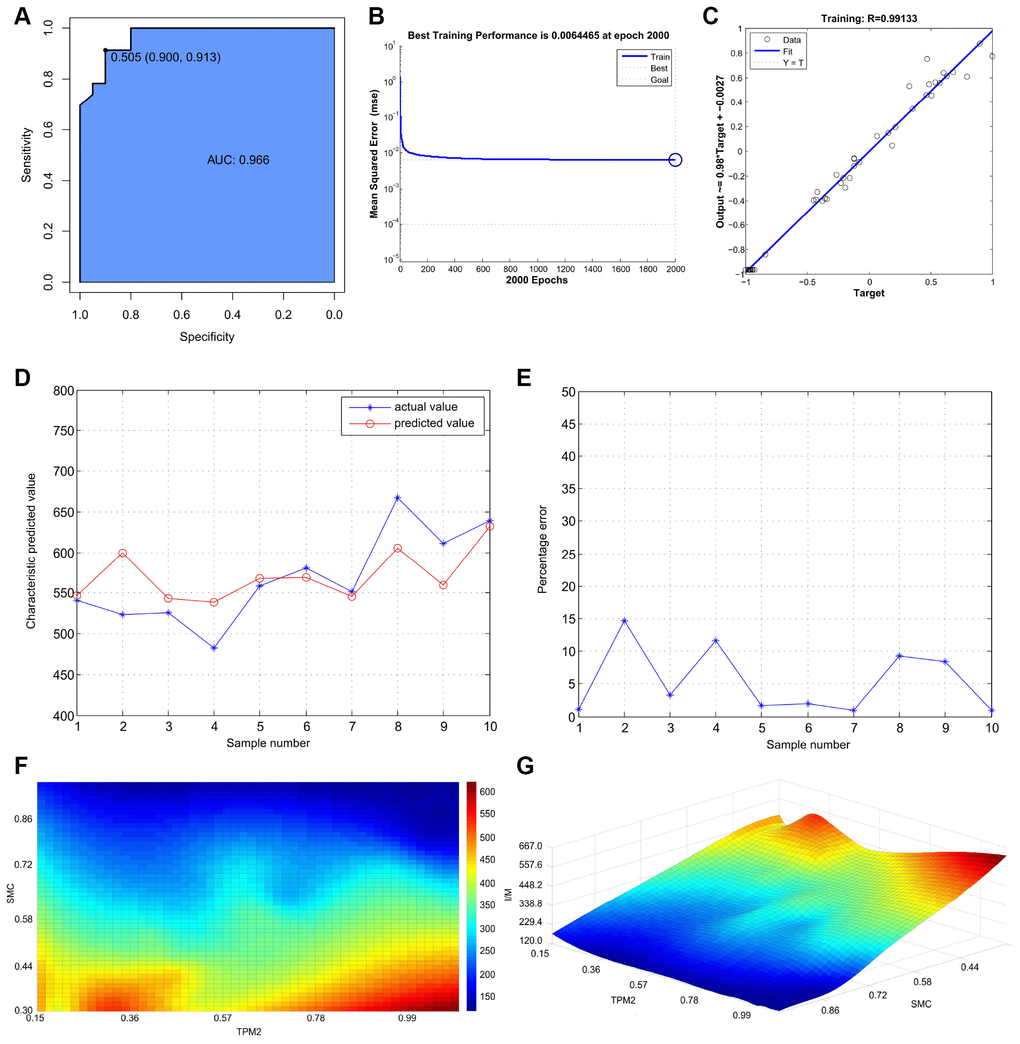
Figure 8.(A) The receiver operator characteristic curve, indicating that the expression level of TPM2 in the own experiment could predict atherosclerosis sensitively and specifically. (B) The neural network prediction model of atherosclerosis intima-media thickness. The best training performance is 0.0064465 at epoch 2000. (C) The final training model of neural network prediction model, and the relativity is 0.99133. (D) Verify the predicted value of the data against the actual value. (E) Verify the data error percentage curve. (F) The high-risk warning range of atherosclerosis intima-media thickness at the level of the planform. (G) The high-risk warning range of atherosclerosis intima-media thickness at the level of the three dimensional stereogram. The color represents the intima-media thickness: the “red” represents “high”, the “blue” represents “low”.