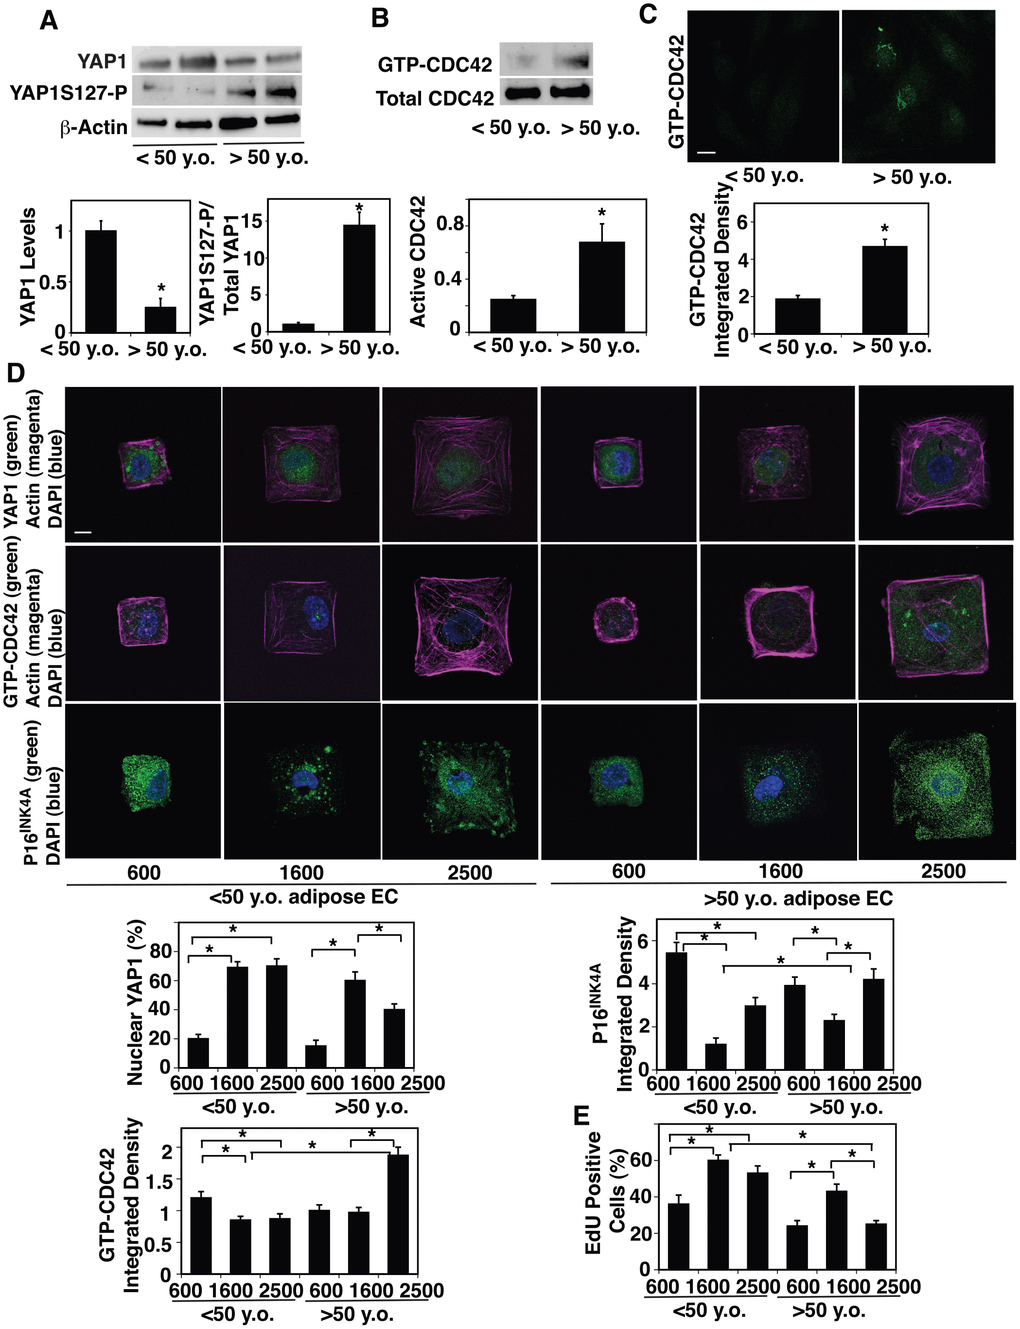
Figure 2.Age-dependent changes in YAP1 and CDC42 activity in human adipose ECs. (A) Representative immunoblots showing YAP1, YAP1S127 phosphorylation and β-actin protein levels in ECs isolated from <50 y.o. and >50 y.o. human adipose tissues (top). Graphs showing the quantification of immunoblots (bottom, n=6, mean ± s.e.m., *, p<0.05). (B) Representative immunoblots showing GTP-CDC42 and total CDC42 protein levels in ECs isolated from <50 y.o. and >50 y.o. human adipose tissues (top). Graph showing the quantification of immunoblots (bottom, n=6, mean ± s.e.m., *, p<0.05). (C) IF micrographs showing the levels of GTP-CDC42 in ECs isolated from <50 y.o. or >50 y.o. human adipose tissues (top). Graph showing quantification of the GTP-CDC42 levels in ECs isolated from <50 y.o. and >50 y.o. human adipose tissues (n=5, mean ± s.e.m., *, p<0.05). (D) IF micrographs showing YAP1 nuclear localization (green), actin (magenta), and DAPI (blue, top), GTP-CDC42 levels (green), actin (magenta) and DAPI (blue, middle), and P16INK4A (green) and DAPI (blue, bottom) in ECs isolated from <50 y.o. or >50 y.o. human adipose tissues cultured on FN-coated island of different sizes. Scale bar, 10 μm. Graphs showing quantification of nuclear YAP1 (left top), GTP-CDC42 integrated density (left bottom) , and P16INK4A integrated density (right top) (n=7, mean ± s.e.m., *, p<0.05). (E) Graph showing quantification of EdU-positive cells (n=7, mean ± s.e.m., *, p<0.05).