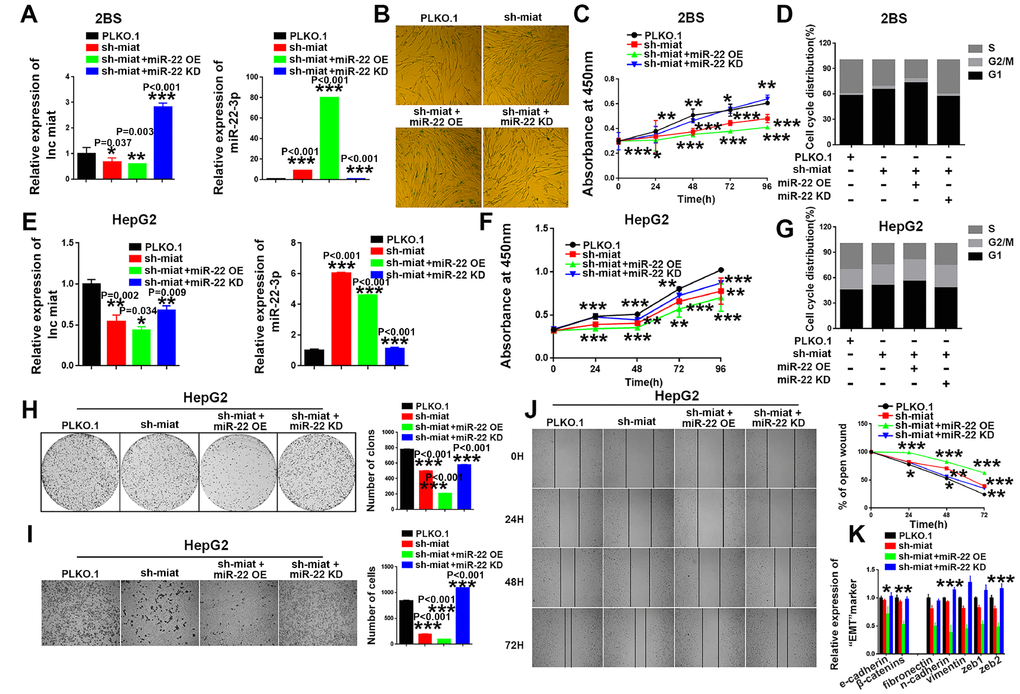
Figure 4.MiR-22-3p is essential for sustaining senescence-like phenotypes and inhibiting hepatic induction by sh-miat. (A) The mRNA levels of miat and miR-22-3p in 2BS cells infected with PLKO.1, sh-miat, or coinfected sh-miat with the miR-22-3p (miR-22 OE)/miR-22-3p inhibitor (miR-22 KD). The bars represent the mean and SD of three independent experiments, *P < 0.05, **P< 0.01, *** P< 0.001. (B) Cellular senescence assay by SA-β-gal staining in 2BS cells infected with PLKO.1, sh-miat, or coinfected sh-miat with the miR-22-3p (miR-22 OE)/miR-22-3p inhibitor (miR-22 KD). (C) Cell proliferation was measured using CCK-8 assays in 2BS cells infected with PLKO.1, sh-miat, or coinfected sh-miat with the miR-22-3p (miR-22 OE)/miR-22-3p inhibitor (miR-22 KD). The bars represent the mean and SD of three independent experiments, *P < 0.05, **P< 0.01, *** P< 0.001. (D) Cell cycle assay was performed in 2BS cells (n=3) infected with PLKO.1, sh-miat, or coinfected sh-miat with the miR-22-3p (miR-22 OE)/miR-22-3p inhibitor (miR-22 KD). (E) The expression of miat and miR-22-3p in HepG2 cells infected with PLKO.1, sh-miat, or coinfected sh-miat with the miR-22-3p (miR-22 OE)/miR-22-3p inhibitor (miR-22 KD). The bars represent the mean and SD of three independent experiments, *P < 0.05, **P< 0.01, *** P< 0.001. (F) Cell proliferation was measured using CCK-8 assays in HepG2 cells infected with PLKO.1, sh-miat, or coinfected sh-miat with the miR-22-3p (miR-22 OE)/miR-22-3p inhibitor (miR-22 KD). The bars represent the mean and SD of three independent experiments, *P < 0.05, **P< 0.01, *** P< 0.001. (G) Cell cycle assay was performed in HepG2 cells (n=3) infected with PLKO.1, sh-miat, or coinfected sh-miat with the miR-22-3p (miR-22 OE)/miR-22-3p inhibitor (miR-22 KD). (H) Cell colony formation assay shown at 14 days after infected with PLKO.1, sh-miat, or coinfected sh-miat with the miR-22-3p (miR-22 OE)/miR-22-3p inhibitor (miR-22 KD) in HepG2 cells. The colony number per field was calculated and is shown in the right panel; n=3, *P < 0.05, **P< 0.01, *** P< 0.001. (I) Representative images of the migratory cells by Transwell assay were captured 24 h after the cells were inoculated, and the results are summarized in the right panel; n=3, *P < 0.05, **P< 0.01, *** P< 0.001. (J) Representative images of the HepG2 cell wound-healing assay were captured at 0, 24, 48 and 72 h after scratching. The wound closure distance was measured with the software from the Leica Application Suite; n=3, *P < 0.05, **P < 0.01 and ***P < 0.001. (K) RT-PCR assay of EMT markers was performed in HepG2 cells infected with PLKO.1, sh-miat, or coinfected sh-miat with the miR-22-3p (miR-22 OE)/miR-22-3p inhibitor (miR-22 KD). The bars represent the mean and SD of three independent experiments, *P < 0.05, **P< 0.01, *** P< 0.001.