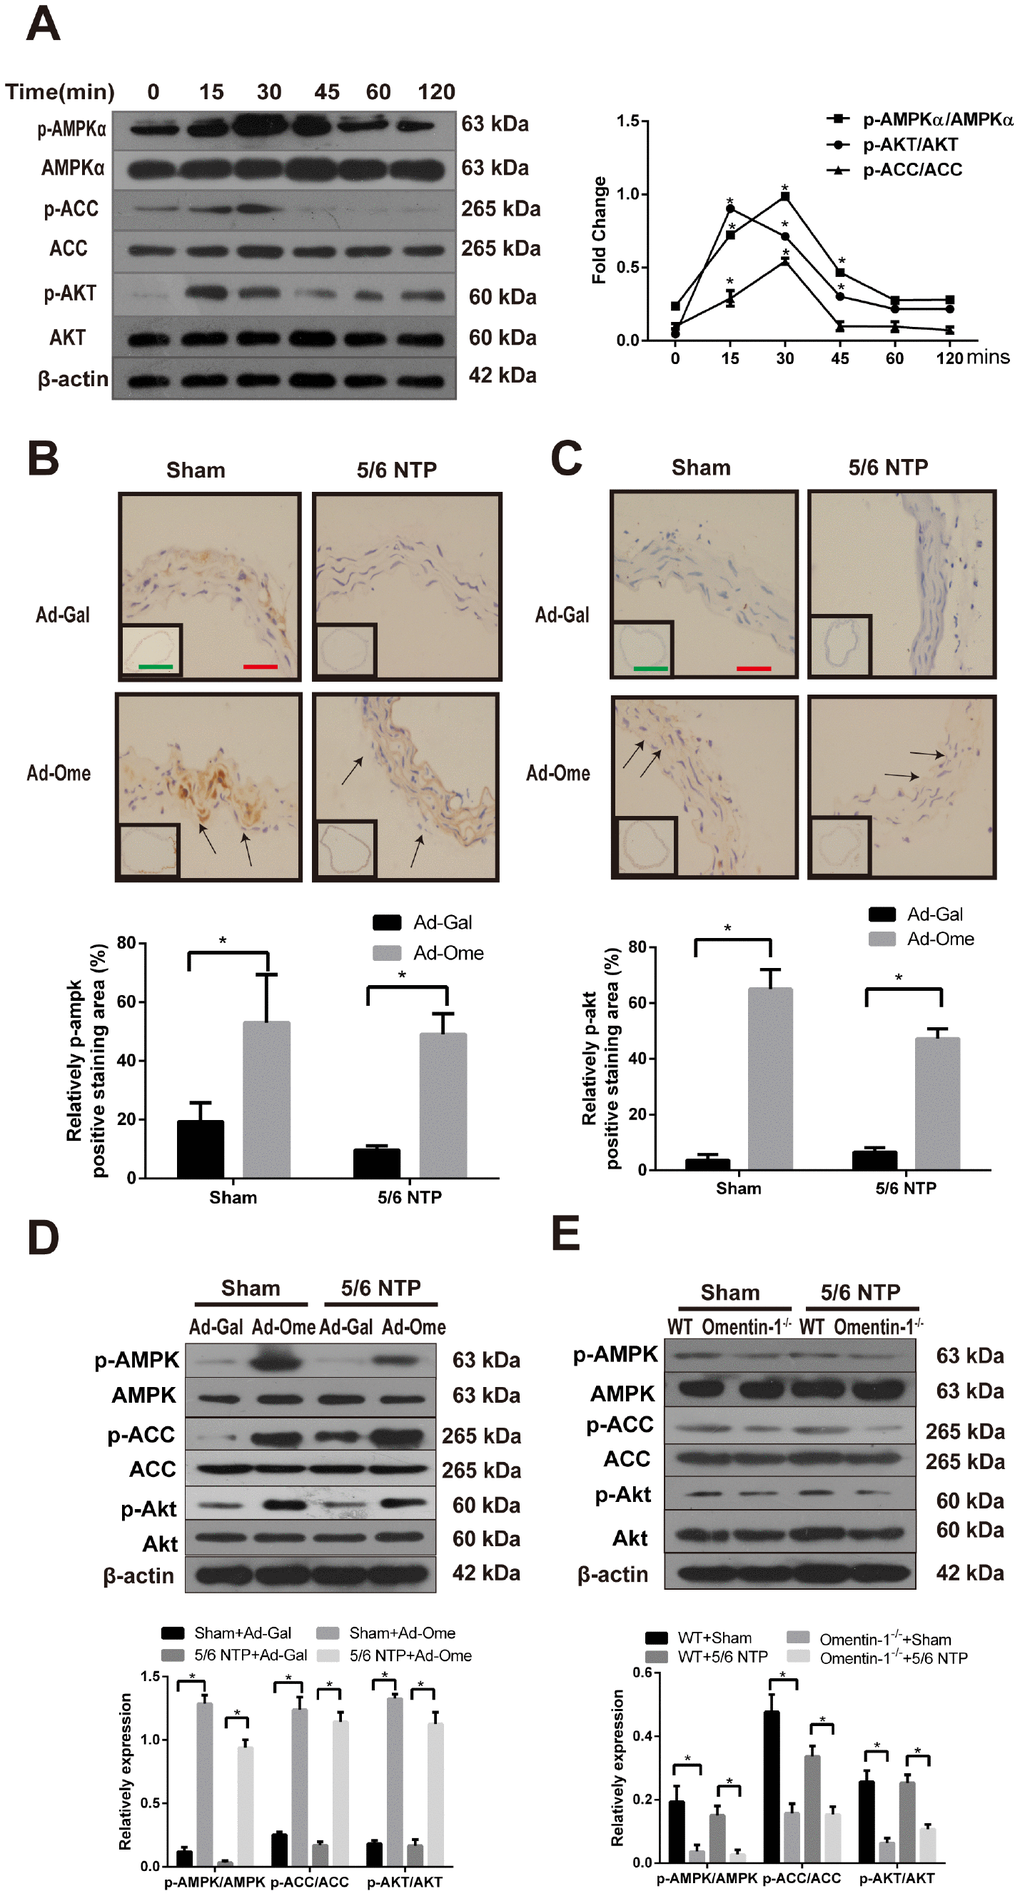
Figure 3.Effects of omentin-1 on activation of AMPK and Akt phosphorylation in CVSMCs and the 5/6 NTP-induced mouse calcification model. (A) CVSMCs were incubated with 400 ng/ml omentin-1 for either 0, 15, 30, 45, 60, or 120 min. Cells lysates were tested by western blot and incubated with antibodies against p-AMPKα, AMPKα, p-Akt, Akt, p-ACC and ACC. Representative results were shown in the left panel and densitometric quantification analysis for phosphorylation of Akt, AMPK and ACC was presented in the right panel. *p < 0.05 vs. respective 0 min, n=3, one-way ANOVA with the Tukey’s HSD post hoc analysis. Mice were subjected to 5/6-nephrectomya or sham operation following by high phosphate diet (0.9% Pi) for indicated time and then the adenovirus-encoding omentin-1 (Ad-Ome) or control adenovirus-encoding β-galactosidase (Ad-Gal) were injected into the tail vein of mice one time per week for four weeks. Expression of p-AMPKα and p-Akt were analyzed by immunohistochemistry. (B) Representative immunostaining of phosphorylation of AMPK proteins (upper panel) and quantity of positive staining area in the thoracic aorta were shown in the lower panel (lower panel). (C) Representative immunostaining of phosphorylation of Akt proteins (upper panel) and quantity of positive staining area in the thoracic aorta were shown in the lower panel (lower panel). (D) Expression of p-AMPK, p-ACC and p-Akt in the mouse aorta treated with Ad-Ome or Ad-Gal were analyzed by western blot. (E) Expression of p-AMPK, p-ACC and p-Akt in the aorta of omentin-1 knockout mice or wild type mice were analyzed by western blot. Scale bar 20 μm (Red) and 500 μm (Green). *p < 0.05 vs. respective control group, n=6, two-way ANOVA with the Tukey’s HSD post hoc analysis. All Results are represented by mean ± SD.