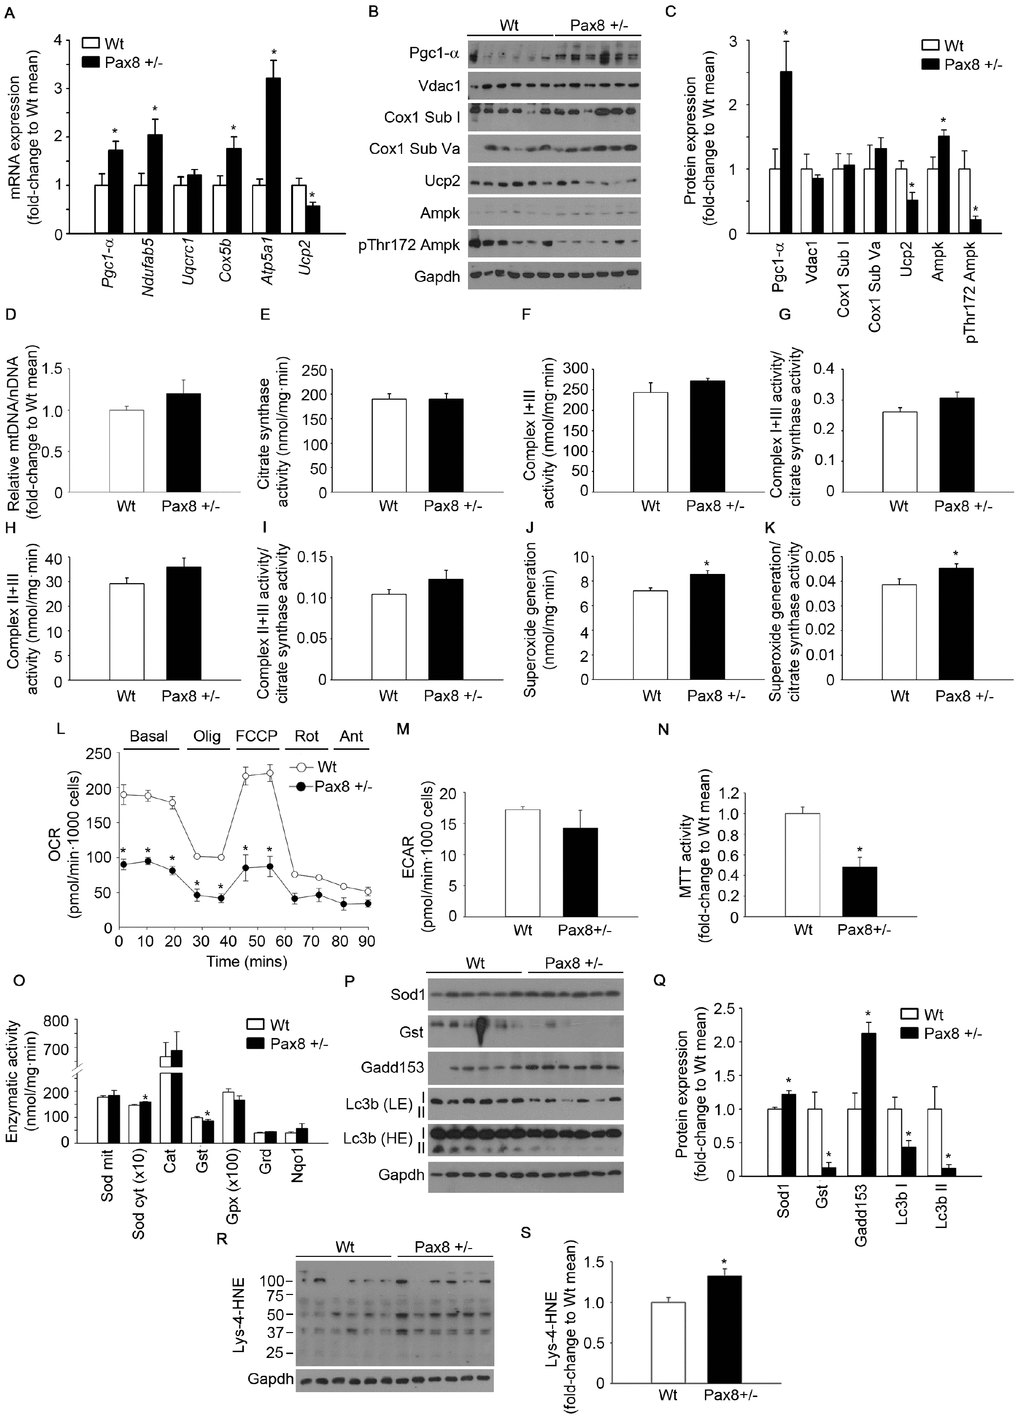
Figure 6.Mild hypothyroidism produces mitochondrial dysfunction and accumulation of oxidative damage in Pax8 +/- mice. (A) mRNA expression of genes involved in mitochondrial biogenesis and mitochondrial function in liver. Pgc1-α: n = 6 per group. Ndufab5 = n = 6 per group. Uqcrc1: n = 6 per group. Cox5b: n = 6 per group. Atp5a1: n = 5 Wt, n = 6 Pax8 +/-. Ucp2: n = 5 per group. (B) Western blots showing expression levels of proteins involved in mitochondrial biogenesis/function as well as Ampk and its phosphorylated isoform in liver lysates. n = 6 per group. (C) Densitometric analysis of western blots shown in panel B. n = 6 per group. (D) Relative mitochondrial DNA content in liver isolations. n = 6 per group. (E) Citrate synthase activity in liver extracts. n = 6 per group. (F) Complex I+III activity in liver extracts. n = 6 per group. (G) Complex I+III activity corrected by citrate synthase activity in liver extracts. n = 6 per group. (H) Complex II+III activity in liver extracts. n = 6 per group. (I) Complex II+III activity corrected by citrate synthase activity in liver extracts. n = 6 per group. (J) Superoxide generation in mitochondrial complexes in liver extracts. n = 6 per group. (K) Superoxide generation in mitochondrial complexes corrected by citrate synthase activity in liver extracts. n = 6 per group. (L) Oxygen consumption rate in primary hepatocytes. n = 3 per group. (M) Extracellular acidification rate in primary hepatocytes. n = 3 per group. (N) MTT test to determine the metabolic activity (NADH-oxidase) of primary hepatocytes. n = 4 per group. (O) Antioxidant enzymatic activities in liver lysates. Sod mit: n = 6 per group. Sod cyt: n = 5 per group. Cat: n = 5 Wt, n = 6 Pax8 +/-. Gst: n = 5 per group. Gpx: n = 5 per group. Grd: n = 6 Wt, n = 5 Pax8 +/-. Nqo1: n = 5 Wt, n = 6 Pax8 +/-. Sod mit: Sod mitochondrial. Sod cyt: Sod cytosolic. (P) Western blots showing expression levels of antioxidant, stress response and autophagy induction proteins in liver lysates. LE = Low exposure. HE = High exposure. n = 6 per group. (Q) Densitometric analysis of western blots shown in panel P. (R) Western blot showing Lys-4-HNE staining in liver extracts. n = 6 per group. (S) Densitometric analysis of the western blot shown in panel R. Mice were 9 month-old at the time of killing. Data are represented as the mean ± SEM. * p-value < 0.05. T-test two tailed.