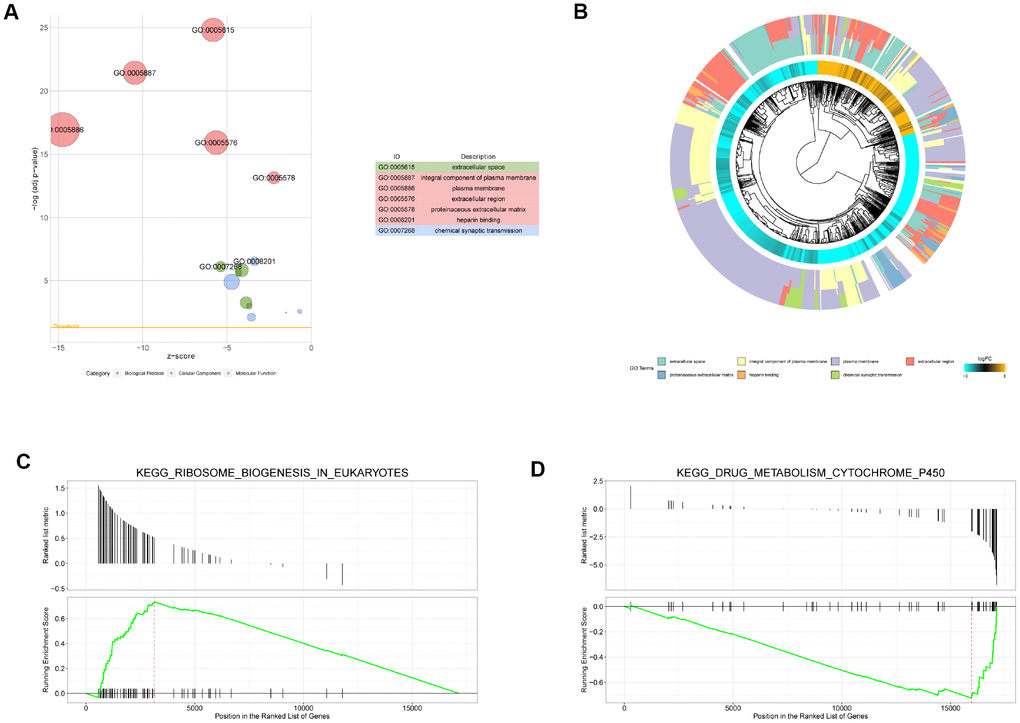
Figure 2.Gene Ontology (GO) and gene set enrichment analysis (GSEA) enrichment analysis. (A) Bubble diagram of GO enrichment analysis (top 7). The circle size indicates the number of enriched genes. Green represents biological process, red represents molecular function, and blue represents cellular component. (B) Cluster diagram of GO enrichment analysis. (C) The upregulated pathway (KEGG_RIBOSOME_BIOGENESIS_IN_EUKARYOTES) of GSEA analysis with the highest enrichment score. (D) The downregulated pathway (KEGG_DRUG_METABOLISM_CYTOCHROME_P450) with the highest enrichment score.