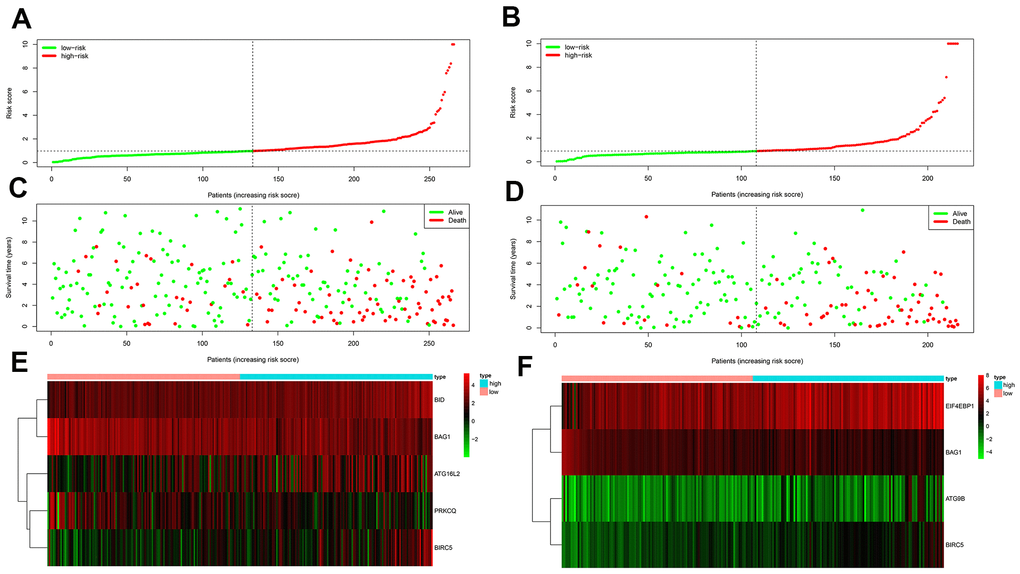
Figure 4.Prognosis of high-risk and low-risk training group ccRCC patients. (A) Risk score distribution of high-risk (red) and low-risk (green) ccRCC patients in the OS model. (B) Risk score distribution of high-risk (red) and low-risk (green) ccRCC patients in the DFS model. (C) Scatter plot shows the survival status of ccRCC patients in the OS model. Red dots denote patients that are dead and green dots denote patients that are alive. (D) Scatter plot shows survival status of ccRCC patients in the DFS model. Red dots denote patients that are dead and green dots denote patients that are alive. (E) Expression of risk genes in the high-risk (blue) and low-risk (pink) training group ccRCC patients in the OS model. (F) Expression of risk genes in the high-risk (blue) and low-risk (green) training group ccRCC patients in the DFS model. The color code for gene expression in E and F shows green denoting lowest expression and red denoting highest expression