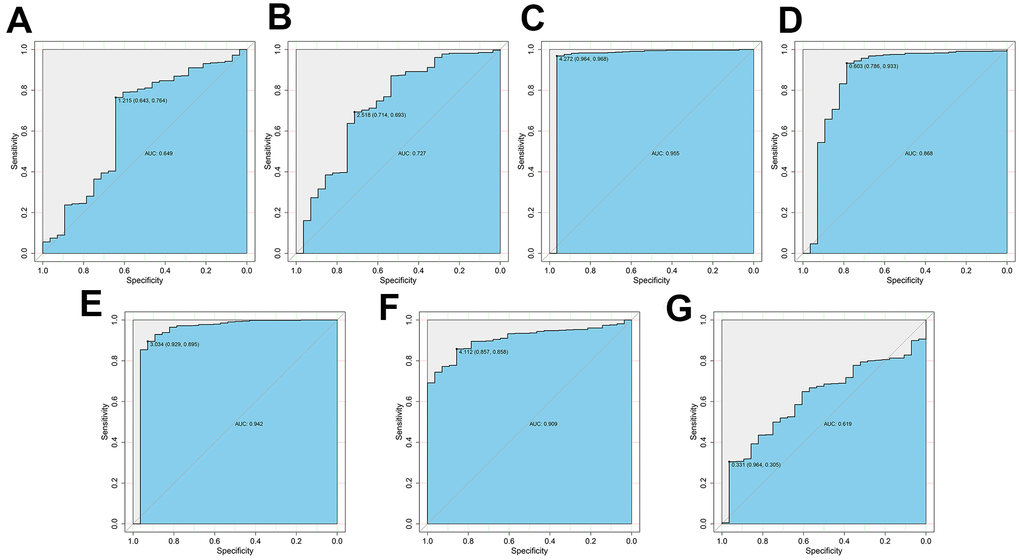
Figure 8.ROC curve analysis to determine potential diagnostic value of the risk DEARGs in ccRCC. The ROC curve plots for (A) PRKCQ (AUC = 0.649), (B) BID (AUC = 0.727), (C) BAG1 (AUC = 0.955), (D) BIRC5 (AUC = 0.868), (E) ATG16L2 (AUC = 0.942), (F) EIF4EBP1 (AUC = 0.909), and (G) ATG9B (AUC = 0.619) genes in ccRCC are shown.