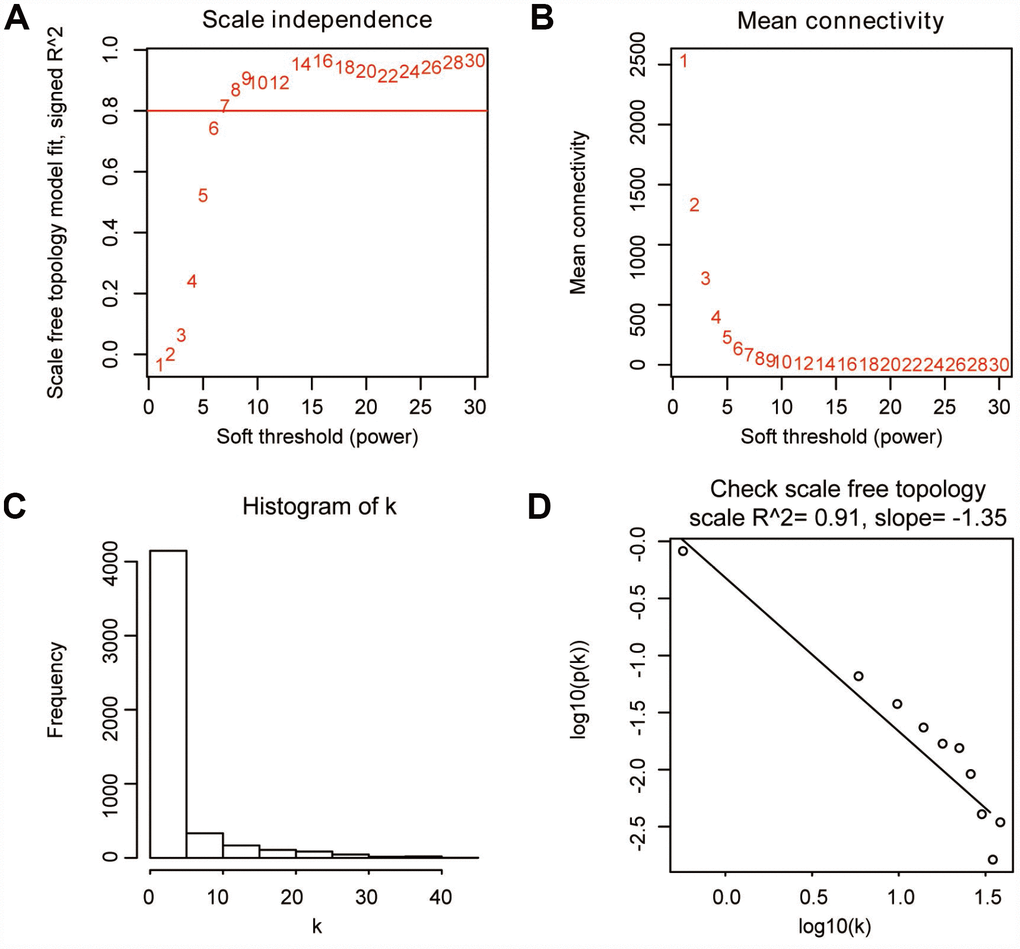
Figure 2.Determination of soft-thresholding parameter in WGCNA. (A) Analysis of the scale-free fit index for various soft-thresholding parameters. (B) Analysis of the mean connectivity for various soft-thresholding parameters. (C) Histogram of connectivity distribution when β=9. (D) Check of scale-free topology when β=9.