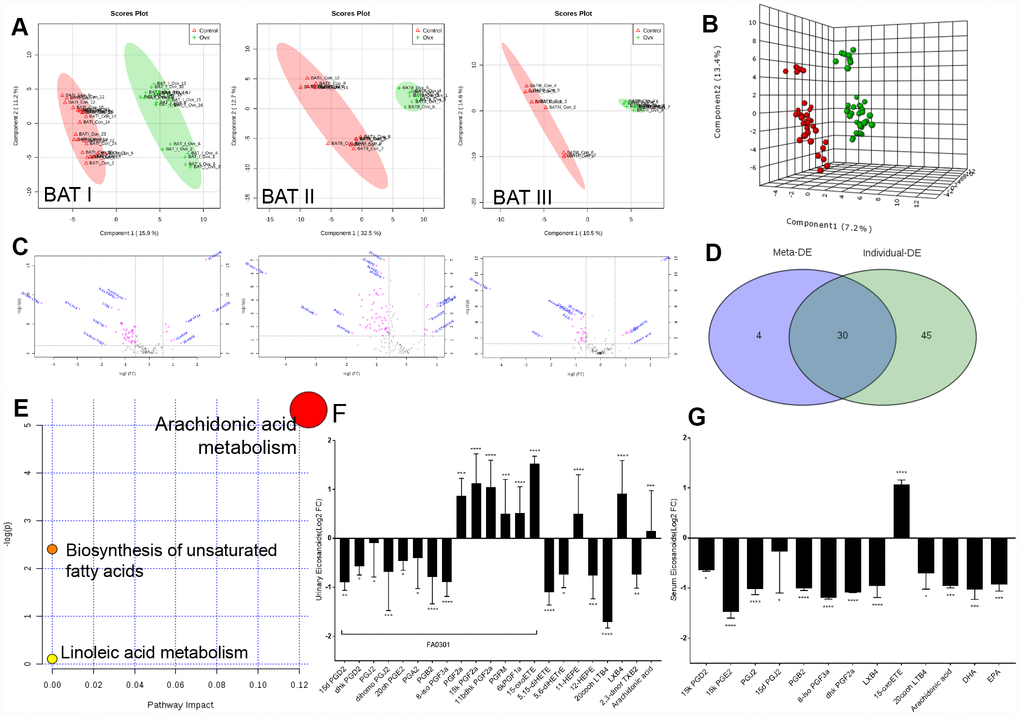
Figure 2.Imbalances of eicosanoids in the kidneys of OVX rats. (A) PLS analysis of the metabolome profile of the kidney in the control and OVX rats from three experiments. (B) Meta-analysis and PLS analysis of urinary eicosanoids in control rats (n = 45) and OVX rats (n = 45). (C) Volcano plot for eicosanoid changes with pink colour reflecting decreases/increases. (D) Venn diagram of the top differentially expressed features from the meta-analysis. (E) Pathway enrichment plot of the biomarkers in each pathway. (F) Liquid chromatography–tandem mass spectrometry analysis of eicosanoids (Log2 FC) from urine samples. (G) Liquid chromatography–tandem mass spectrometry analysis of eicosanoids (Log2 FC) from serum samples. n=6, mean ± s.d., compared to control rats, *p < 0.05, **p < 0.005, ***p < 0.0005 and ****p < 0.0001.