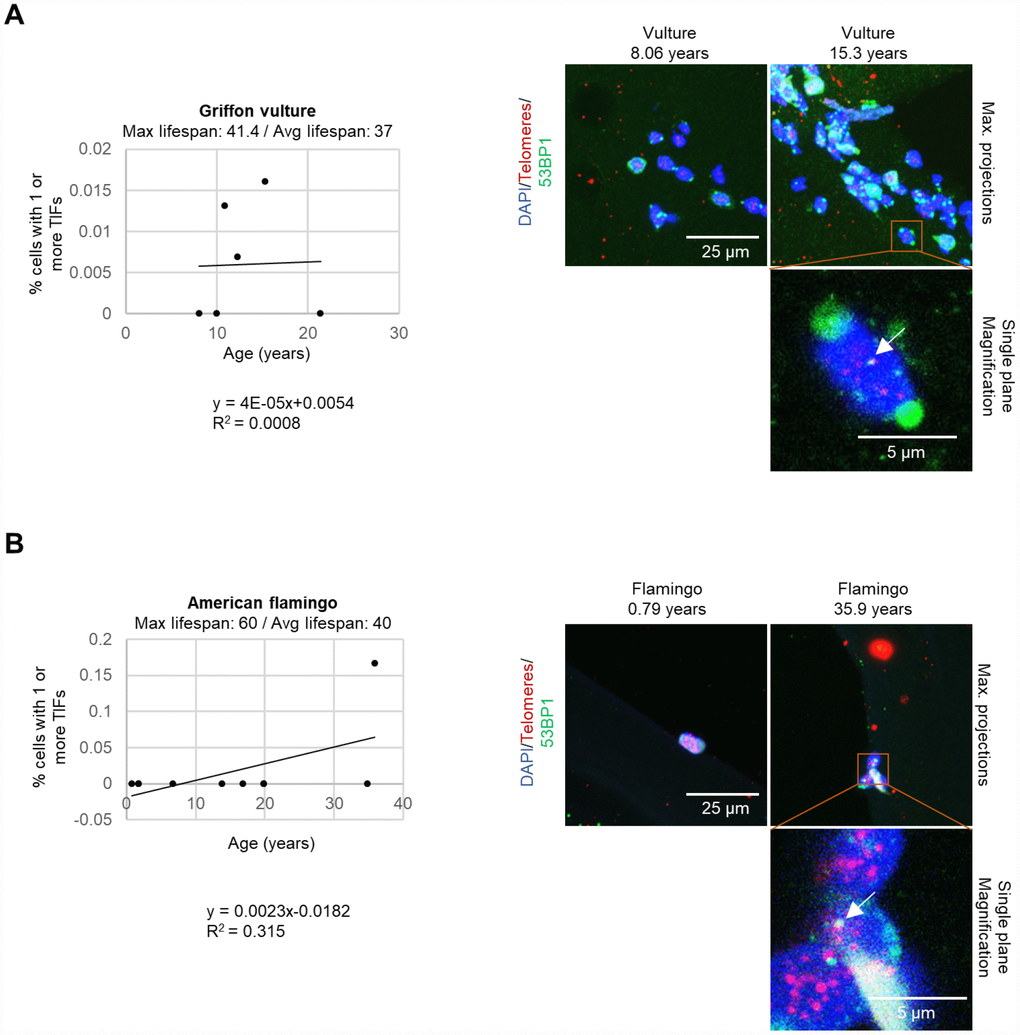
Figure 5.TIFs measured in leukocytes. (A) The percentage of cells with one or more TIFs in griffon vultures. The age and number of cells measured for each individual was as follows: 8.06 years: 77 cells, 10 years: 29 cells, 10.9 years: 153 cells, 12.3 years: 146 cells, 15.3 years: 125 cells, and 21.4 years: 173 cells. (B) The percentage of cells with one or more TIFs in American flamingos. The age and number of cells measured for each individual was as follows: 0.79 years: 3 cells, 1.75 years: 12 cells, 1.8 years: 34 cells, 6.75 years: 21 cells, 13.8 years: 11 cells, 16.9 years: 9 cells, 19.9 years: 7 cells, 19.9 years: 7 cells, 34.9 years: 20 cells, and 35.9 years: 6 cells. In the representative images, the nuclei are stained blue with DAPI, the telomeres are red, and the 53BP1 stain is in green. 53BP1 staining at the very edge of nuclei was not counted as foci. The top row of the representative images shows maximum projections which are the result of taking the maximum value of several different z-planes. The magnification image is displayed for a single plane rather than a maximum projection to show co-localization of the stains. A white arrow indicates a colocalization of 53BP1 and a telomere spot (a TIF).