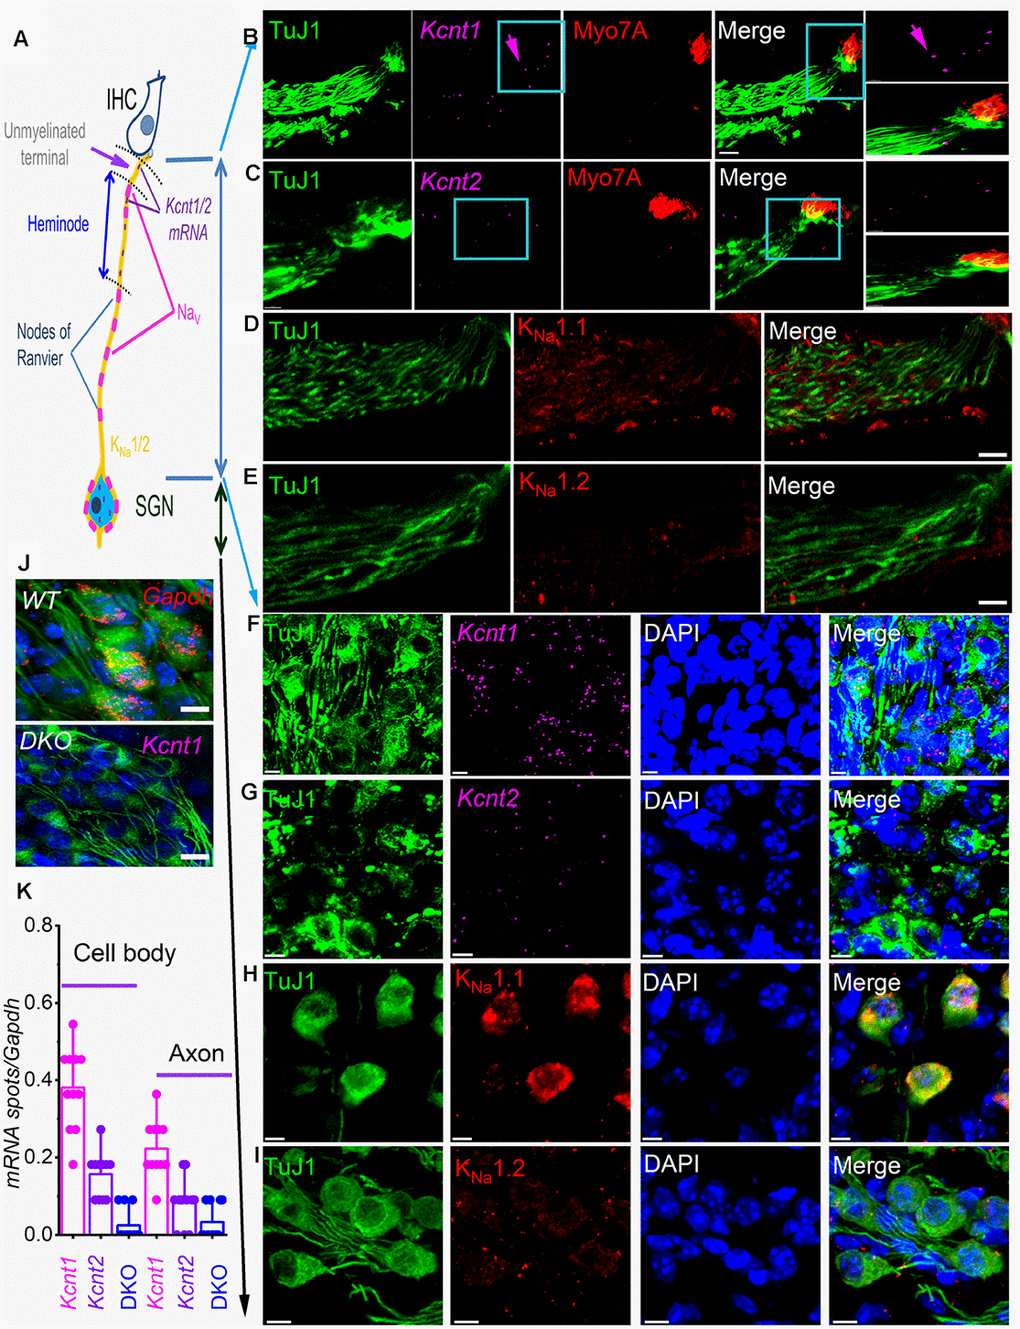
Figure 1.sm-FISH and immunocytochemistry localize transcripts and proteins for KNa1.1 and KNa1.2 in axons and cell bodies of spiral ganglion neurons (SGNs). Expression of KNa1-encoding transcripts in the SGNs was examined using smFISH and standard immunocytochemistry in the organ of Corti (OC)/SGN preparations from 1-mo old C57 mice (B–I). (A) Schematic illustration of the inner hair cell (IHC), type I SGN, the peripheral axon, and cell body. The unmyelinated terminal, heminode, and nodes of Ranvier are noted, but not to scale. (B) RNA molecules encoding for KNa1.1 (Kcnt1), and (C) KNa1.2 (Kcnt2), were detected as fluorescent spots (purple, arrow) in TUJ1-positive (green) SGN axons, IHCs were labeled with myosin 7A antibody (red), and merged images are shown. Axonal Kcnt1 mRNA were prominent, but only scant Kcnt2 mRNA spots were detected compared to the double knockout (DKO) samples (J). Scale bar = 10 μm (D–E) Images of cochlear sections of 1-mo old mice show that KNa1.1 (red) protein is expressed in the auditory nerve in D. Consistent with the faint expression of Kcnt2 mRNA in the axons in (E) there was virtually little or no detectable expression of KNa1.2 in axons of the auditory nerve. Scale bar = 10 μm. (F–G) mRNA spots (purple spots) encoding KNa1.1 (Kcnt1), and KNa1.2 (Kcnt2) in the cell bodies of SGNs. Very few spots for Kcnt2 mRNA were detected. Sections were co-labeled with neuronal (TuJ1, green) and nuclei markers (4,6-diamidino-2-phenylindole, DAPI, blue) Scale bar = 5 μm. (H–I) Images of the SGNs show KNa1.1 (red) protein is expressed in cell bodies of the auditory nerve. In keeping with low levels of expression of mRNA, KNa1.2 protein expression was faintly positive. The mean number of RNA molecules detected per SGN was calculated as described in the Methods. Kcnt1 levels were higher compared to Kcnt2 in both mRNA and protein levels. (J) (Upper panel). Photomicrograph showing SGN mRNA spots (red spots) encoding Gapdh (data was obtained from DKO tissue). (Lower panel) DKO cochlear section, using kcnt1 probe serving as negative controls. Similar data were obtained using the kcnt2 probe (data not shown). Scale bar = 5 μm. (K) Values of mRNA spots in axons and cell bodies were normalized against Gapdh mRNA spots/100 μm2 (11 ± 2 spots (n = 31)) are summarized in the form of bar graphs. The mean (mean ± SD) was (cell body, kcnt1 = 0.38 ±.0.11; kcnt2 = 0.16 ± 0.06; DKO = 0.02 ± 0.04; n = 11 animals; derived from 50 randomly selected cells and evaluated by 5 blinded individuals. The mean (mean ± SD) was (axons, kcnt1 = 0.22 ±.0.07; kcnt2 = 0.08 ± 0.06; DKO = 0.03 ± 0.05; n = 11 animals; derived from 50 randomly selected cells and evaluated by 5 blinded individuals.