


Introduction
Previous studies have demonstrated distinct local domain-specific protein translation as a mechanism to confer multiple temporal and spatial neuronal functions [1]. However, the merits of distinct functional segregations may be offset by local and latent neuropathology that can escape early detection, an overture for intervention. Auditory information processing relies heavily on precise temporal signal transmission [2]. Loss of sound segregation [3] is one of the emergent, early signs of age-related hearing loss (ARHL) [4, 5]. Previously, ARHL was determined by increased audiometric thresholds [6, 7]. Recent studies in humans and animal models have demonstrated that traces of ARHL may begin much earlier than previously predicted. A standard threshold characterizes the early signs of ARHL, but there is a reduced suprathreshold amplitude of sound-elicited compound action potentials (AP), a reduction in peak I, and an increase in latency of the auditory brainstem response (ABR) waveform [8, 9]. Because of the apparent normal threshold but reduced physiological characteristics, the phenomenon has been named hidden hearing loss (HHL) [3, 8, 10, 11]. HHL may degrade spike reliability and precision, and result in compensatory hyperactivation of auditory neurons (AN) in higher brain centers, causing tinnitus [11, 12]. Thus, the prevailing notion is that HHL begets additional auditory deficits and overt increases in audiometric threshold. These findings suggest that early but latent mechanisms underlying the development of ARHL if identified can be repressed, or reversed to prevent progression to overt HL. What are the mechanisms of HHL and the transition steps to overt HL? To date, structural dysfunction of the inner hair cell (IHC) synapse and transient primary AN demyelination have been demonstrated as two of the mechanisms of HHL [3, 8].
The cochlea houses inner hair cells (IHCs) that encode sound information by transducing mechanical stimuli into neurotransmitter release, and electrical signals that are relayed by type I spiral ganglion neurons (SGNs) to the cochlear nucleus (CN) and ascending auditory pathways [13]. Type I SGNs are bipolar neurons that extend unbranched myelinated projections, which form single ribbon synapses with one IHC [14]. A single IHC is innervated by ~6-20 type I SGNs in the mature mouse cochlea. Presynaptic ribbons and postsynaptic densities are marked by C-terminal Binding Protein 2 (CtBP2) [15], a postsynaptic density 95 protein (PSD95), and AMPA-type glutamate receptors [16, 17]. The heminodes of type I afferents are decorated with Na+ channels to initiate the rising phase of action potentials (APs) to ensure swift acoustic conduction [18]. Paradoxically, increased Na+ current density can produce enhanced membrane instabilities, which disrupt spike synchrony and impede AP conduction speed [19, 20]. The interplay between Na+ currents and activation of K+ currents may be essential in regulating membrane potential jitters. Indeed, we have recently demonstrated that primary AN expressed Na+-activated K+ channels, KNa1.1 (SLO2.2/Slack), and KNa1.2 (SLO2.1/Slick) (KNa) [21]. Null deletion of the two genes Kcnt1 and Kcnt2 [22], result in HHL [21]. We hypothesized that there are stepwise cellular mechanisms from HHL to overt HL in the kcnt1 and kcnt2 null mouse model.
Here, we show that KNa channels mRNA is distinctly and locally expressed in dendritic projections of primary ANs, raising the possibility that the channels play unique roles in synaptic functions. We demonstrate that Na+-activated K+ channels regulate spike jitters introduced by Na+ currents. Null deletion of Kcnt1 and Kcnt2, result in HHL in the absence of structural changes in synaptic morphology. By a persistent Na+ current, KNa current contributes toward the resting membrane potential (RMP) of SGNs. Thus, attenuation of KNa current in Kcnt1 and Kcnt2 (double knock out (DKO)) in SGNs leads to depolarized RMP, resulting in reduced AP amplitude, translating into ABR peak I amplitude reduction and increased delay, but normal ABR thresholds and synaptic morphology. Owing to local attenuation of KNa current activity, there is a long-term global increase in membrane activity, leading to enhanced intracellular Ca2+ (Ca2+i) and altered Ca2+ handling. These changes culminated with a gradual activation of caspase 3/9, impaired regulation of inositol triphosphate receptor 1 (IP3R1), and apoptosis-mediated synaptic and neuro-degeneration. The findings demonstrate how a change in local neuronal activity can lead to progressive disease. It also identifies a potential interventional platform to treat ARHL.
Results
Local Kcnt1 and Kcnt2 mRNA and proteins at postsynaptic terminals and soma of SGNs
KNa1.1 and KNa1.2 have been localized in the medial nucleus of the trapezoid body (MNTB) in the auditory brainstem and shown to regulate spike timing [24, 25] and in peripheral neurons in the dorsal root ganglion (DRG), where they regulate nociceptive responses [23, 26, 27]. However, Kcnt1 and Kcnt2 mRNA have recently been localized in SGN cell bodies [21]. To determine the roles of the KNa1 channels, we examined the expression pattern of mRNA and protein in SGNs. Figure 1A provides a schematic diagram of an IHC and SGN for orientation. In addition to the expected localization of mRNA in SGNs soma, where the channels are synthesized, Kcnt1, and Kcnt2 mRNA were surprisingly detected at the synaptic projections (Figure 1B–1E). The expression levels of Kcnt1 were consistently higher than Kcnt2 in SGNs (Figure 1). Local protein translation has been identified to be essential for axonal maintenance [28], dendritic functions [29–31], and synaptic plasticity [32]. Indeed, localized axonal K+ channel translation has been reported [33]. We examined the expression of KNa1.1 and KNa1.2 in different compartments of SGNs. KNa1.1 was densely, and KNa1.2 was faintly expressed at the cell body and dendritic projections (Figure 1D, 1E, 1H, 1I). Local expression of KNa channels suggests that channel activity may regulate synaptic function and axonal action potential (AP) conduction.
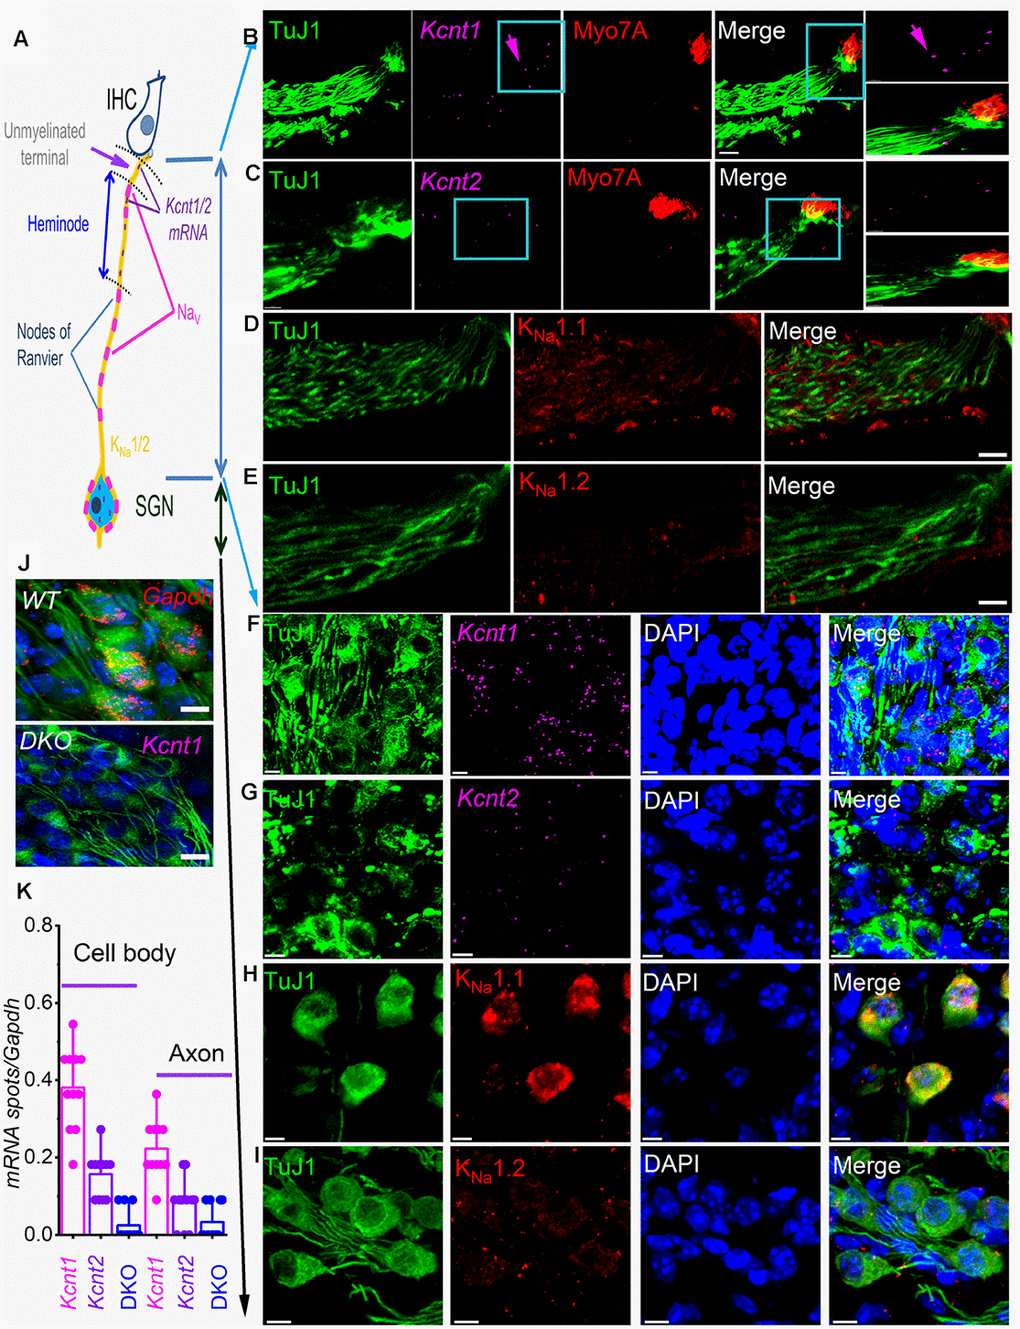
Figure 1. sm-FISH and immunocytochemistry localize transcripts and proteins for KNa1.1 and KNa1.2 in axons and cell bodies of spiral ganglion neurons (SGNs). Expression of KNa1-encoding transcripts in the SGNs was examined using smFISH and standard immunocytochemistry in the organ of Corti (OC)/SGN preparations from 1-mo old C57 mice (B–I). (A) Schematic illustration of the inner hair cell (IHC), type I SGN, the peripheral axon, and cell body. The unmyelinated terminal, heminode, and nodes of Ranvier are noted, but not to scale. (B) RNA molecules encoding for KNa1.1 (Kcnt1), and (C) KNa1.2 (Kcnt2), were detected as fluorescent spots (purple, arrow) in TUJ1-positive (green) SGN axons, IHCs were labeled with myosin 7A antibody (red), and merged images are shown. Axonal Kcnt1 mRNA were prominent, but only scant Kcnt2 mRNA spots were detected compared to the double knockout (DKO) samples (J). Scale bar = 10 μm (D–E) Images of cochlear sections of 1-mo old mice show that KNa1.1 (red) protein is expressed in the auditory nerve in D. Consistent with the faint expression of Kcnt2 mRNA in the axons in (E) there was virtually little or no detectable expression of KNa1.2 in axons of the auditory nerve. Scale bar = 10 μm. (F–G) mRNA spots (purple spots) encoding KNa1.1 (Kcnt1), and KNa1.2 (Kcnt2) in the cell bodies of SGNs. Very few spots for Kcnt2 mRNA were detected. Sections were co-labeled with neuronal (TuJ1, green) and nuclei markers (4,6-diamidino-2-phenylindole, DAPI, blue) Scale bar = 5 μm. (H–I) Images of the SGNs show KNa1.1 (red) protein is expressed in cell bodies of the auditory nerve. In keeping with low levels of expression of mRNA, KNa1.2 protein expression was faintly positive. The mean number of RNA molecules detected per SGN was calculated as described in the Methods. Kcnt1 levels were higher compared to Kcnt2 in both mRNA and protein levels. (J) (Upper panel). Photomicrograph showing SGN mRNA spots (red spots) encoding Gapdh (data was obtained from DKO tissue). (Lower panel) DKO cochlear section, using kcnt1 probe serving as negative controls. Similar data were obtained using the kcnt2 probe (data not shown). Scale bar = 5 μm. (K) Values of mRNA spots in axons and cell bodies were normalized against Gapdh mRNA spots/100 μm2 (11 ± 2 spots (n = 31)) are summarized in the form of bar graphs. The mean (mean ± SD) was (cell body, kcnt1 = 0.38 ±.0.11; kcnt2 = 0.16 ± 0.06; DKO = 0.02 ± 0.04; n = 11 animals; derived from 50 randomly selected cells and evaluated by 5 blinded individuals. The mean (mean ± SD) was (axons, kcnt1 = 0.22 ±.0.07; kcnt2 = 0.08 ± 0.06; DKO = 0.03 ± 0.05; n = 11 animals; derived from 50 randomly selected cells and evaluated by 5 blinded individuals.
Furthermore, the distribution of the channel proteins along the soma-dendrite axis, including the heminodal region, varied, raising the possibility that KNa channels may confer distinct functions. The heminode of the peripheral axon is the spike initiation site with high Na+ channel density [34] and the origin of auditory information coding [35]. We reasoned that KNa1 regulates Na+ channel activity, and the null deletion of KNa1 channels may have a functional impact on SGN properties and overall pre-CN auditory function. To address the functional roles of KNa1 channels, we took advantage of a DKO mouse model [23].
Null deletion of Kcnt1 and Kcnt2 (DKO) resulted in HHL and gradual transition to overt hearing loss
To test the hypothesis that deletion of KNa1.1 and KNa1.2 might cause short- and long-term auditory deficits, we performed ABRs analyses. We determined not only the sound pressure levels (SPL) at which the characteristic ABR waveform could be detected but also changes in wave (peak) one/two (PI/PII) amplitudes and latencies with respect to sound stimulus intensity. The motivation for the latter was that the origin of PI/PII might stem from type I afferent postsynaptic terminal [36, 37] or at the soma [38] (pre-CN), where KNa1.1 and KNa1.2 expression is high (Figure 1). The analyses were performed for 1-, 3-, 6- and 9-months (mo) old DKO mutant and their age-matched C57 WT mice. The sound stimuli were broadband click (Figure 2) and pure tones at 4, 8, 16, and 32 kHz (Figure 3). WT mice yielded the characteristic ABR waveform at 1 mo of age with thresholds of 20-30 dB across different test frequencies. The hearing remained unchanged until 6-9-mo old when the threshold increased to 40-45 SPL. For the example shown in Figure 2A–2D, all five ABR peaks were apparent in response to an 80-dB stimulus. In contrast, DKO mice exhibited a markedly reduced PI amplitude waveform compared to the WT at all ages (1-9 mo). Analyses of the input/output (I/O) function of PI and PII amplitude and latency between WT and DKO across ages showed that while PI amplitudes and latencies were markedly reduced and delayed, respectively, in response to a click stimulus, the thresholds in 1- and 3-mo old DKO were equivalent to those of the WT mice (Figure 2E–2G). However, by 6-mo and beyond, the DKO mice exhibited significant changes in PI and PII amplitudes and latencies. Sound thresholds in response to clicks and pure tones stimuli have increased significantly (Figures 2G, 3). For clarity, data for pure tones 4, 8, 16, and 32 kHz are illustrated in Figure 3. The results from the DKO mice at ages 1-3 mo have a striking resemblance to the physiological signatures of HHL, and in 6 mo and older animals, the HHL has transitioned to canonical HL, whereby there is a significant increase in the absolute hearing threshold (Figures 2G, 3). To understand the cellular mechanisms for alterations of ABR waveforms in the DKO, we examined the SGN response properties, using mice with documented HHL and overt HL.
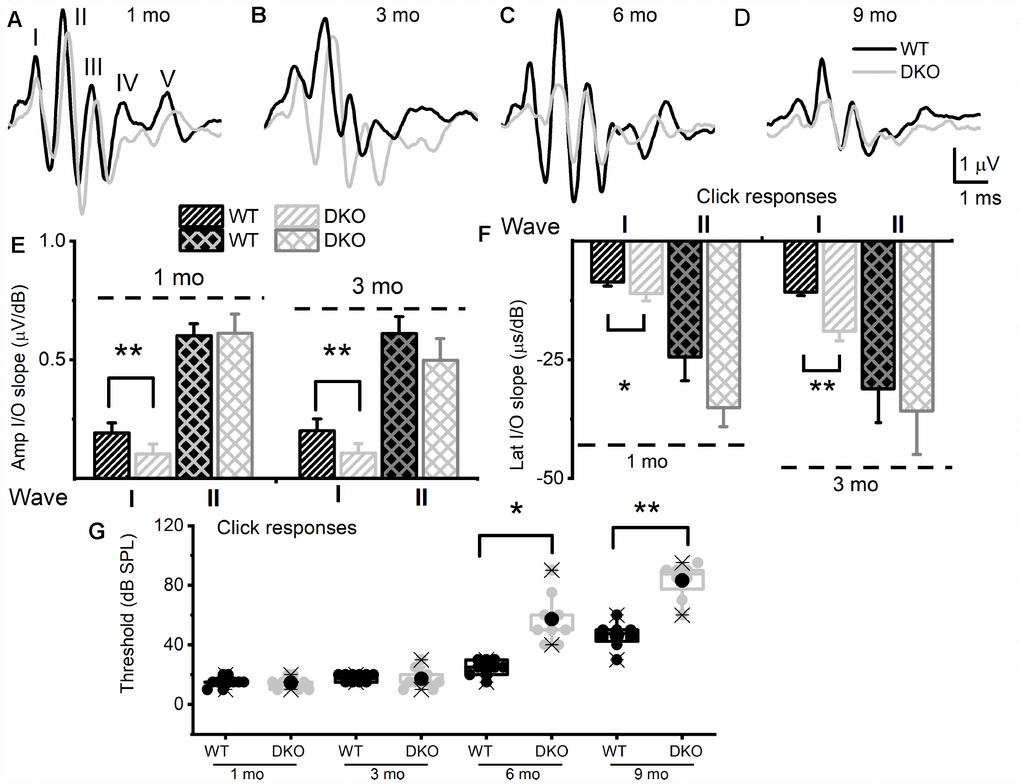
Figure 2. KNa1 DKO mice have reduced and delayed wave I auditory brainstem responses (ABR) but normal absolute thresholds from ages 1 to 3-mo-old in comparison with WT animals, and by 6-mo-old, showed a profound increase in absolute thresholds, relative to the WTs. ABRs were measured in 1-, 3-, 6- and 9-mo old WT and DKO mice. (A–D) Representative ABR traces in response to 80 dB SPL sound clicks are shown for WT (black) and DKO (light grey), at ages 1-, 3-, 6- and 9-mo old as indicated. (E) Average waves I and II amplitudes (input/output, I/O) linear regression slope functions were determined for responses to sound clicks. Wave I, but not wave II, amplitudes were significantly reduced in DKO mice compared to WT mice in response to click sound in 1-mo old. In 3-mo old wave II was significantly different. The mean values for 1-mo old mice for wave I (I/O slope (μV/dB); mean ± SD) were; WT = 0.19 ±.0.04; DKO = 0.10 ± 0.04; n = 11; p < 0.0001. Mean wave II values were; WT = 0.60 ±.0.05; DKO = 0.61 ± 0.08; n = 11; p = 0.7. The mean values for 3-mo-old mice for wave I (I/O slope (μV/dB); mean ± SD) were; WT = 0.20 ±.0.05; DKO = 0.11 ± 0.04; n = 11; p < 0.0001. Mean wave II values were; WT = 0.61 ±.0.07; DKO = 0.50 ± 0.09; n = 11; p = 0.004. (F) Average waves I and II latency (input/output, I/O) functions versus sound clicks. Wave I latency I/O linear regression slopes were significantly different between WT and DKO mice. The mean values for 1-mo old mice for wave I latency (I/O slope (μs/dB); mean ± SD) were; WT = 8.60 ±.0.82; DKO = 11.05 ± 1.57; n = 11; p < 0.0002. Mean wave II values were; WT = 24.40 ±.5.01; DKO = 35.09 ± 4.02; n = 11; p = 0.0001. The mean values for 3-mo old mice for wave I (I/O slope (μV/dB); mean ± SD) were; WT = 10.73 ±.0.73; DKO = 18.93 ± 2.02; n = 11; p < 0.0001. Mean wave II values were; WT = 31.09 ±. 7.11; DKO = 35.80 ± 9.12; n = 11; p = 0.192. Additionally, the I/O slope (μV/dB) of wave I amplitude at 6-mos and 9-mos were; WT = 0.16 ± 0.05; DKO = 0.08 ± 0.06; n = 10; p = 0.005 and (9-mos); WT = 0.14 ± 0.08; DKO = 0.05 ± 0.02; n = 10; p = 0.04. The I/O slope (μs/dB) of wave I latency at 6-mos and 9-mos were; WT = 12.37 ± 0.91; DKO = 20.81 ± 3.11; n = 10; p < 0.0001 and (9-mos); WT = 13.21 ± 1.06; DKO = 22.63 ± 4.11; n = 10; p < 0.0001. (G) Mean absolute ABR thresholds in response to click stimulus were not statistically significantly different between WT and DKO mice in 1-3 mo old but were significantly different in 6- and 9-mo old mice. The mean values for ABR thresholds for 6-mo old were (dB SPL); WT = 24.44 ± 5.27; DKO = 57.22 ± 16.41; n = 9; p = 0.0002. Mean thresholds for or 9-mo old were; WT 46.25 ± 8.76; DKO = 83.13 ± 11.93; n = 8; p < 0.0001.
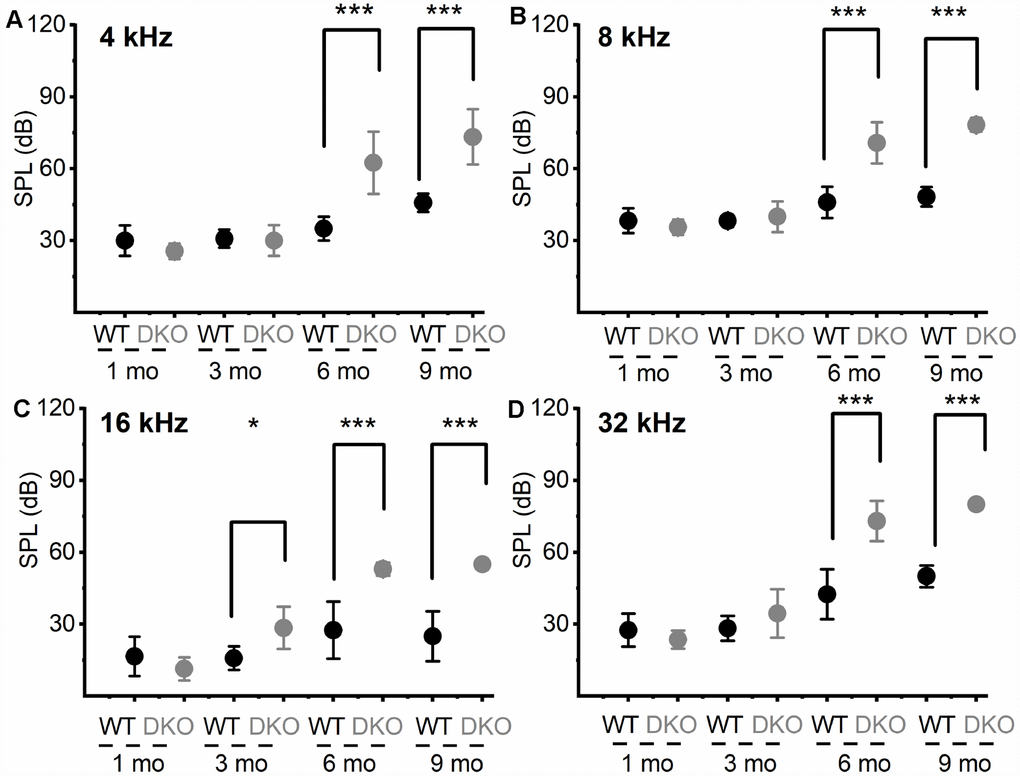
Figure 3. Changes in pure tone responses. (A–D) Mean absolute ABR thresholds in response to pure tones (4, 8, 16 and 32 kHz) were not statistically significantly different between WT and DKO mice in 1- and 3-mo old, but were significantly different in 6- and 9-mo old mice. Summary data are expressed as (mean ± SD), and statistical comparisons are shown. For 4 KHz, the mean thresholds (in dB SPL) at 6 mos were; WT = 35.00 ± 5.00; DKO = 62.50 ± 12.94; n = 8; p = 0.0001. Mean thresholds at 9 mos were; WT = 45.83 ± 3.76; DKO = 73.33 ± 11.55; n = 8; p = 0.0001. For 8 KHz, the mean thresholds (in dB SPL) at 6 mos were; WT = 46.00 ± 6.52; DKO = 70.83 ± 8.60; n = 8; p = 0.0001. Mean thresholds at 9 mos were; WT = 48.30 ± 4.10; DKO = 78.30 ± 2.89; n = 8; p = 0.0001. For 16 KHz, the mean thresholds (in dB SPL) at 3 mos were; WT = 15.83 ± 4.91; DKO = 28.50 ± 8.83; n = 8; p = 0.0032. Mean thresholds at 6 mos were; WT = 27.50 ± 11.90; DKO = 53.00 ± 2.74; n = 8; p = 0.0001. Mean thresholds at 9 mos were; WT = 25.00 ± 10.49; DKO = 55.00 ± 0.00; n = 8; p = 0.0001. For 32 KHz, the mean thresholds (in dB SPL) at 6 mos were; WT = 42.50 ± 10.40; DKO = 73.84 ± 8.37; n = 8; p = 0.0001. Mean thresholds at 9 mos were; WT = 50.00 ± 4.47; DKO = 80.00 ± 0.00; n = 8; p = 0.0001.
HHL in DKO results from increased membrane jitters, and altered SGN response properties
To assess the transition from HHL to overt HL in DKO mice requires a longitudinal evaluation of the functional properties of SGNs from 1-9-mo old. Previously, recordings from 1.5-mo old DKO SGN cell bodies showed increased membrane excitability [21], which at face value appear paradoxical since ABR PI amplitude is reduced and delayed (Figure 2). For 1-mo old SGNs, the most consistent findings were significant RMP depolarization in the DKO SGNs compare to WT neurons (apex; WT, -65 ± 3 mV, n = 31; DKO, -58 ± 2 mV, n = 27; p < 0.001: base; WT, -57 ± 2 mV, n = 25; DKO, -53 ± 4 mV, n = 31; p < 0.001), and reduced AP amplitude (apex; WT, 80.0 ± 2.7 mV, n = 31; DKO, 72.1 ± 4.8 mV, n = 27; p < 0.001: base; WT, 83.2 ± 3.4 mV, n = 25; DKO, 72.0 ± 5.1 mV, n = 25; p < 0.001; also see Figure 5). Although the DKO SGNs showed increased spike frequency compared to the WT, we observed an increased failure rate of evoked AP using suprathreshold current injection (Figure 4). Additionally, with constant subthreshold current injection, the extent of depolarization was more variable in the DKO than for WT neurons. As illustrated in Figure 4E–4H, the variance of membrane-potential jitters was greater for the DKO SGNs than age-matched WT neurons (Figure 4E, 4F). Increased membrane excitability and jitter in DKO SGNs were seen in 1, and 3-mo old mice. Surprisingly, the functional differences in response properties between the WT and DKO SGNs were not apparent in 4-5-mo old neurons (Figure 5). However, by 6 mos and older (9 mos), the response properties of basal SGNs from DKO compared to WT were in stark contrast to the increased membrane excitability shown in 1-3-mo old neurons (Figure 5). In older mice (> 6-mo-old), SGNs isolated from DKO mutant mice required increased current to evoke APs compared to age-matched WT SGNs (Figure 4I–4K). AP amplitudes, latency, and duration from both basal and apical neurons from older DKO mice were consistent with reduced membrane excitability; a startling transition from young (1-3-mo old) and robustly excitable electrophysiological phenotypes, in comparison with older SGNs (6-9 mo old) and relatively quiescent membrane activity (Figures 4, 5).
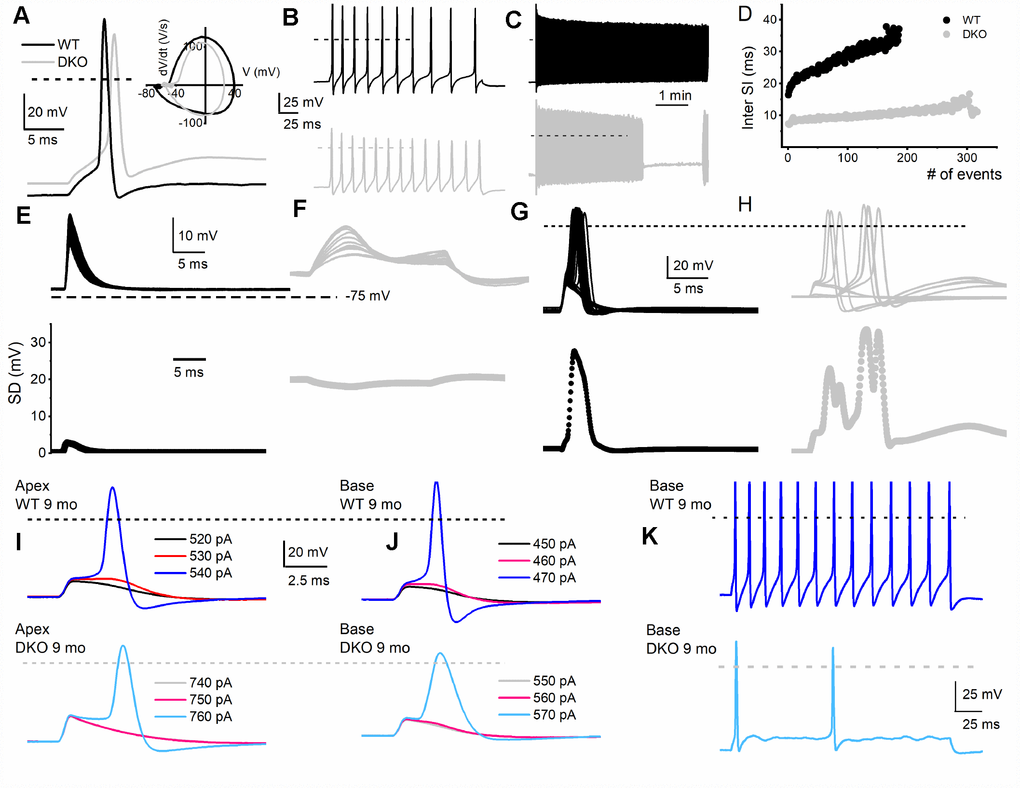
Figure 4. Membrane properties of SGNs from WT and DKO mice. To minimize experimental variabilities, SGN recordings were performed using mice, with recorded ABR. Current-clamp recordings were performed on SGNs isolated from the basal and apical one-third of the cochlea from 1-, 3-, 4-5- (not shown), 6- and 9-mo old WT and DKO mice. (A) Action potentials (AP) evoked from 1-mo-old SGNs isolated from cochlear apical turn from WT (black trace) and DKO (grey trace) mice. Both the resting membrane potential (RMP) and AP amplitude were significantly altered in WT versus DKO SGNs. RMP of apical SGNs; WT, -65 ± 3 mV, n = 31; DKO, -58 ± 2 mV, n = 27; p < 0.001: RMP of basal SGNs; WT, -57 ± 2 mV, n = 25; DKO, -53 ± 4 mV, n = 31; p < 0.001). AP amplitudes were; apical SGN; WT, 80.0 ± 2.7 mV, n = 15; DKO, 72.1 ± 4.8 mV, n = 15; p < 0.001: basal SGN; WT, 83.2 ± 3.4 mV, n = 17; DKO, 72.0 ± 5.1 mV, n = 19; p < 0.001). Dotted black and gray lines indicate 0 mV. (B, C) Examples of slow adapting SGNs isolated from a 1-mo-old basal cochlear turn. For the example shown in (B) typical spike frequency (in Hz) for WT SGNs = 45 ± 7 (n = 17) and DKO = 67 ± 11 (n = 21); p < 0.0001. (D) The dairy plot of the inter-spike interval of slow adapting SGNs from WT and DKO. (E, F) 50 consecutive subthreshold depolarization (0.075 nA current injection) of WT SGNs (E, black traces), and DKO (F, grey traces), demonstrating the extent of membrane jitters. Plotted below is the corresponding standard deviation. (G, H) 30 consecutive suprathreshold depolarization (0.2 nA current injection; interstimulus interval, 2s) of WT SGNs (G, black traces), and DKO (H, grey traces), demonstrating the extent of membrane jitters in evoked APs. Plotted below is the corresponding standard deviation. DKO membrane voltage is pre-disposed to increased membrane jitters. (I, J) APs evoked in SGNs from 9-mo old WT (upper panel) cochlea were generally slower to initiate and larger in amplitude compared to those evoked in SGNs from DKO (lower panel) cochlea. The magnitudes of the injected current are indicated. (K) Across SGNs, the excitability of DKO SGNs has plummeted by several-fold. For the example shown, the spike frequency was reduced by ~7-fold.
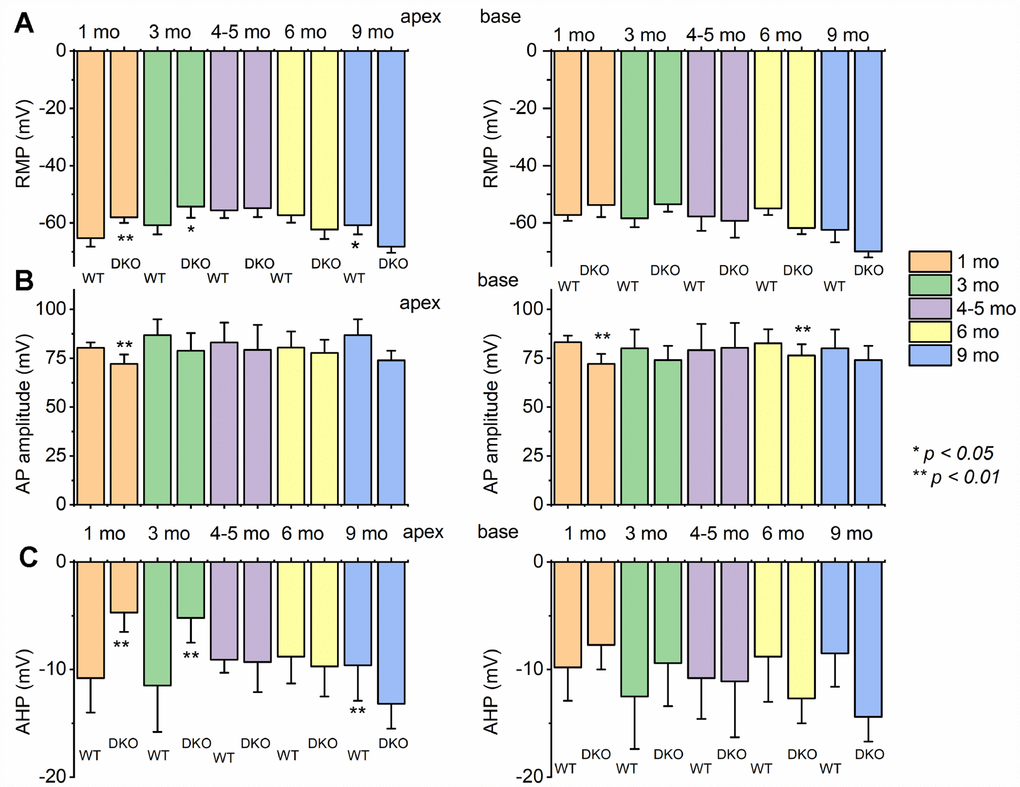
Figure 5. Changes of membrane properties of WT versus DKO SGNs isolated from cochlear apex and base at different ages (1- 3- 4-5- 6- and 9-month). (A) The resting membrane potential (RMP) of SGNs was significantly altered at different stages in development. (B) Changes in AP amplitudes of WT and DKO SGNs from apical and basal cochlea are summarized. (C) Amplitude of afterhyperpolarization (AHP) measured and summarized (*p < 0.05; **p < 0.01; n = number of SGNs are indicated). For these data, significant differences between genotypes were determined using the unpaired two-tailed t-test. Other action potential parameters such as latency and duration were measured but not shown (we did not identify any significant changes in action potential latency and duration in WT versus DKO at different stages of development and location in the cochlea).
The source of Na+ for KNa channel activation
The Na+ source for activation of KNa channels is expected to regulate the amplitude and kinetics of KNa current profoundly. Since the major source of intracellular Na+ in SGNs is entry through voltage-gated Na+ current (INa), we assessed the properties of INa in WT and DKO mice. In WT SGNs, under conditions where Ca2+, K+, and Cl- currents were suppressed (see Methods), we observed ~-5-10 pA/pF (-7.1 ± 3.3 pA/pF, n = 34) holding current that was attenuated at potentials close to the reversal potential of Na+ (ENa). The holding current plummeted (-2.4 ± 1.6 pA/pF, n = 11; p = 0.001), using Na+ current recording bath solutions containing 1 μM TTX, suggesting the apparent persistent current was carried by Na+ channels, consistent with previous reports [18]. Another important observation was that in current-clamp mode, and using the regular bath and pipette solution, the RMP of SGNs shifted by ~5 ± 1 mV (n = 19) in the positive direction, upon application of 1 μM TTX (not shown).
To determine the biophysical underpinnings for the different evoked response properties of the WT and DKO SGNs, we measured whole-cell inward Na+ currents from WT and DKO SGNs from a holding potential of -90 mV, using depolarizing steps from -70 mV to 35 mV (ΔV = 2.5 mV). Inward Na+ currents, normalized to individual SGN membrane capacitance (Cm), were recorded from apical and basal SGNs from 1-mo-old WT and DKO mice (Figures 6A, 6B; 7). We observed consistent differences in the peak current-density voltage relation (I-V) among WT apical (-57.2 ± 4.1 pA/pF) and basal (-71.2 ± 6.4 pA/pF), compared to DKO apical (-37.1 ± 3.7 pA/pF) and basal (-57.1 ± 3.9 pA/pF) SGNs, respectively. Voltage-dependent inactivation was tested at -10 mV, using pre-pulse voltages ranging from -90 mV to 60 mV (ΔV = 5 mV) (see representative traces, inset, Figure 6C). The normalized peak recovered-current versus pre-pulse voltage curves were generated from data collected in both 1-mo WT and DKO SGNs from apical and basal cochlear turns (Figures 6C, 7). Using 150-300-ms duration pre-pulses, ~20% of the WT and ~9% of the DKO Na+ currents appeared available for activation. The half-inactivation potentials (V1/2) and the slope factors for the inactivation curves were measured by fitting the plots to the Boltzmann function (summary data provided in legend, Figures 6 and 7). By superimposing the steady-state activation and inactivation curves of Na+ currents from WT and DKO SGNs, we estimated that ~20% of the WT current was available at the RMP. The sustained Na+ influx would activate the KNa current compared to DKO current (~10%), which would be devoid of KNa activation. The resultant activation of KNa current in the WT is expected to shift the membrane voltage towards the reversal potential of K+ (EK ~-80 mV). Indeed, the negative voltage shifts (5-8 mV) in the RMP are expected to increase the available evoked Na+ currents in both apical and basal SGNs, consistent with the data gleaned from TTX blockade of the Na+ current. These results are in keeping with the significant increase in AP amplitude and rapid upstroke (dV/dt) of WT neurons (Figure 4A). In contrast, in DKO SGNs, depolarized membrane voltage coupled with reduced availability of Na+ current promotes membrane jitters and AP failure, despite the closeness of the RMP of DKO SGNs to AP threshold.
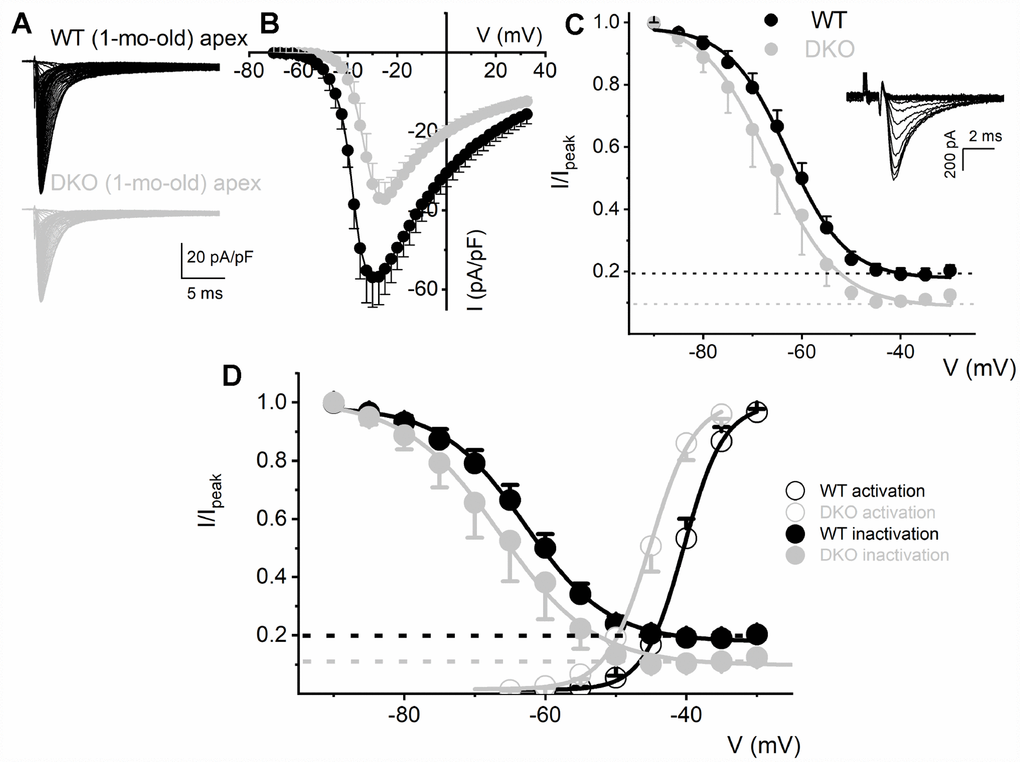
Figure 6. Reduced Na+ current density and available current in KNa1 DKO SGNs. (A) Whole-cell inward Na+ currents were elicited using depolarizing steps from -70 mV to 35 mV (ΔV = 2.5 mV). The currents were normalized to individual membrane capacitance (Cm), were recorded from 1-mo-old mice using apical SGNs from WT (shown with black traces) and DKO (shown with grey traces). Data were generated from 19 SGNs from each experimental group. (B) We observed consistent differences in peak Na+ current (I)- voltage (V) relation among WT (●) apical and DKO (●) SGNs. (C) Voltage-dependent inactivation was tested at -10 mV, using pre-pulse voltages ranging from -90 mV to 60 mV (ΔV = 5 mV) (see representative traces, inset). The mean normalized peak recovered-current versus voltage relation for WT (black line and symbol) and DKO (grey line and symbol) SGN from apical third of the cochlea are plotted (n = 9). The half-inactivation potentials (V1/2) were measured by fitting plots to the Boltzmann function. The V1/2 for WT was -62.9 ± 2.5 mV and the slope factor k, was, 6.2 ± 0.7 mV (n = 11) and DKO was -66.3 ± 2.7 mV and the slope factor k, was 6.9 ± 0.3 mV (n = 13). (D, E) WT (D) and DKO (E) activation and inactivation curves to illustrate window current and sustained/persistent Na+ currents available for activation of KNa1 current. The activation curves for Na+ currents from WT and DKO were fitted with the Boltzmann function. The V1/2 for activation WT SGN was -40.4 ±3.6 mV, and the slope factor k, was 2.9 ± 0.5 mV (n = 9) and DKO was -45.1 ± 4.8 mV, and the slope factor k, was 3.08 ± 0.8 mV (n = 11).
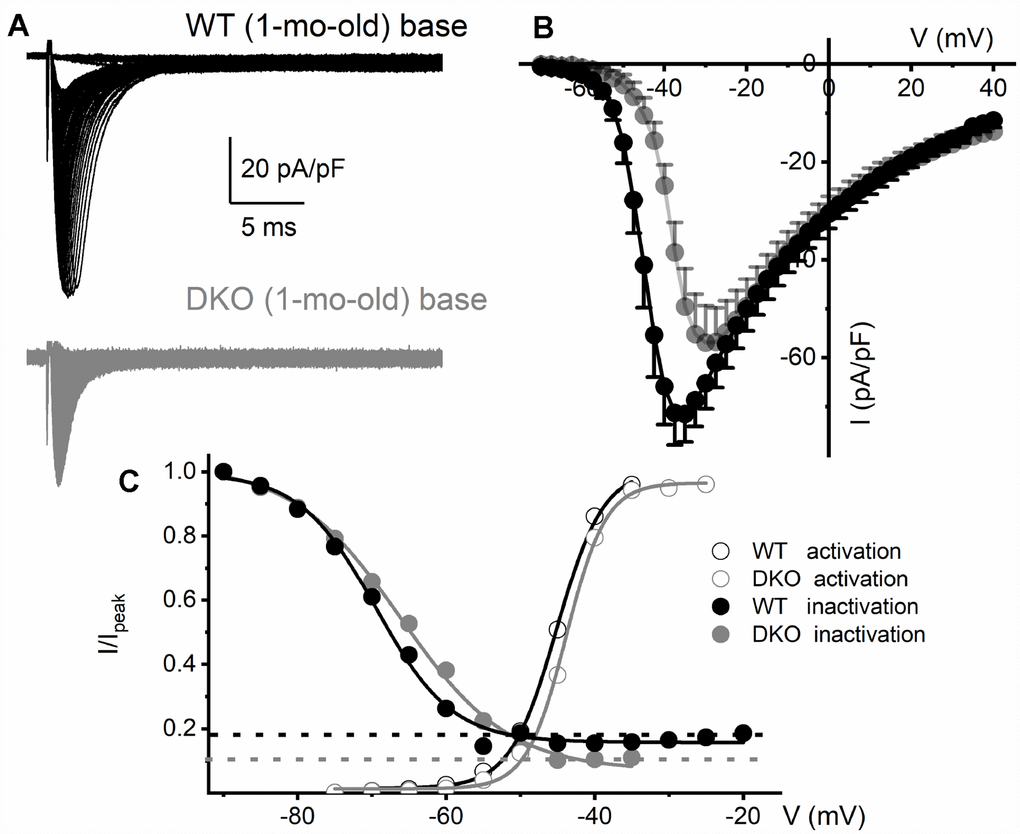
Figure 7. Reduced Na+ current density and available current in KNa1 DKO SGNs. (A) Whole-cell inward Na+ currents were elicited using depolarizing steps from -70 mV to 35 mV (ΔV = 2.5 mV). The currents normalized to individual membrane capacitance (Cm), were recorded from 1-mo-old mice using basal SGNs from WT (shown with black traces) and DKO (shown with grey traces). Data were generated from 15 SGNs of each experimental group. (B) Consistent differences were noted in the peak Na+ current (I)- voltage (V) relation among WT (●) apical and DKO (●) SGNs. (C) In WT ~20% of the Na+ current is sustained, and in the DKO, ~10% persisted. Voltage-dependent activation and inactivation curves fitted with Boltzmann functions. Half-inactivation potentials (V1/2) were measured by fitting plots to them. The V1/2 of the steady-state inactivation for WT was -69.5 ± 3.1 mV and the slope factor k, was, 5.1 ± 0.9 mV (n = 9) and DKO was -66.3 ± 2.7 mV and the slope factor k, was 7.3 ± 0.7 mV (n = 11). The activation curves for Na+ currents from WT and DKO were fitted with the Boltzmann function. The V1/2 for activation WT SGN was -45.1 ± 2.8 mV, and the slope factor k, was 3.1 ± 0.8 mV (n = 9) and DKO was -43.8 ± 2.6 mV, and the slope factor k, was 2.7 ± 0.5 mV (n = 11).
Intracellular Ca2+ handling is altered in SGN from DKO mice
The transition from depolarized to hyperpolarized membrane potential from 1 and 3 mo to 6 and 9 mo old DKO SGNs suggested potentially relevant intervening compensatory changes. To begin to address the cellular mechanisms, we tested whether the initial enhanced membrane depolarization in the DKO SGNs may promote increased Ca2+ influx compared to age-matched WT neurons. We monitored intracellular Ca2+ concentration in 1-mo old WT and DKO SGNs using the Ca2+ indicator Fluo-4, and ratiometric Ca2+ (Fura-2) imaging. We measured field-potential evoked Ca2+ transients in SGNs loaded with fluo-4. The Ca2+ transients were captured using confocal line scan imaging (Figure 8A). The decay phase of the Ca2+ transients was fitted using two exponential functions (Figure 8B), showing a significant prolongation in DKO neurons. Ca2+ transient amplitude was also significantly increased in DKO SGNs.
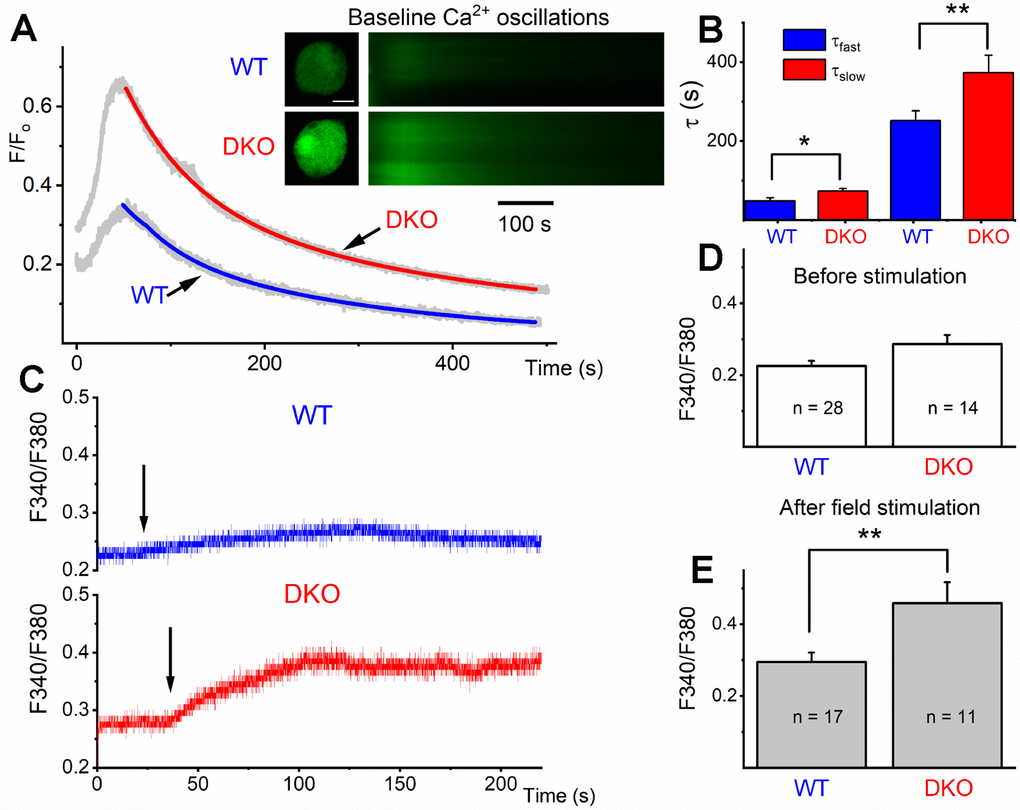
Figure 8. Ca2+ transients in 1-mo old SGNs from WT and DKO mice. (A) Representative examples of line-scan images (inset) captured from unstimulated but spontaneous Ca2+ oscillations showing Ca2+ transients recorded from WT (upper panel, in black) and DKO (lower panel, in gray) SGNs. Sample records show SGN loaded with Fluo 4. (B) Summary data for the fast and slow time constant (τ1 and τ2) of the Ca2+ transient decay at baseline using two exponential functions. The τ1 (ms) for WT = 48.4 ± 7.9; DKO = 73.2 ± 6.3; n = 19 (p = 0.019): and τ2 (ms) for WT = 251.7 ± 24.5; DKO = 373.3 ± 44.2; n = 17 (p = 0.022). (C) Sample records show a region of interest (ROI) of ratiometric Fura 2 assessment of field potential (10V/4Hz) depolarization of WT and DKO SGN (arrows show the time of stimulation). Recovery after field stimulation had ~500-1000s time course (not shown). (D, E) Summary data for the amplitude of the total Ca2+ at baseline and after field stimulation in WT and DKO SGNs (1-mo old apical neurons). The F340/380 for WT before field stimulation = 0.23 ± 0.01 (n = 28); DKO = 0.29 ± 0.03; n = 14 (p = 0.029): and after field stimulation WT = 0.29 ± 0.03 (n = 17); DKO = 0.46 ± 0.06; n = 11 (p = 0.007). Significant differences between genotypes were determined using unpaired two-tailed t-test.
Increased Ca2+ levels could affect overall Ca2+ homeostasis. To substantiate these findings, we used ratiometric Ca2+ dye, Fura-2, for semi-quantitative assessment. SGNs cell bodies loaded with Fura-2 AM were imaged. The cell bodies of 1-mo old WT and DKO SGNs had a relative baseline Ca2+ concentrations that were significantly different (F340/F380; WT = 0.226 ± 0.03 (n = 28), DKO = 0.286 ± 0.025 (n = 14; p < 0.05: Figure 8C, 8D). Field stimulation of Fura-2 AM loaded SGNs isolated from DKO showed ~2-fold Ca2+ rise (Figure 8C, 8E). The slow delay in recovery after baseline rise in Ca2+ and increased amplitude of Ca2+ transient is likely to alter Ca2+ handling in DKO SGNs compared to WT neurons, resulting in a long-term rise in Ca2+ concentrations. These intrinsic alterations in Ca2+ handling are expected to have short- and long-term effects on synaptic and neuronal functions.
Delayed synaptopathy and normal SGN myelination in DKO mice
The existing correlation in HHL is a loss of afferent synapses between IHC and SGNs and demyelination of SGN dendritic projections [3, 8], while overt hearing loss is ascribed to HC or SGN loss [49–51]. Using N-terminal antibodies to CtBP2 and PSD95, we performed immunostaining for presynaptic ribbons and postsynaptic receptors in WT and DKO mice. Although HHL was observed in 1 and 3 mo old DKO mice, IHC synaptic density was similar between WT and DKO cochleae in all frequency regions examined (Figure 9A, 9B, 9E–9H). By contrast, DKO mice older than 6-mos old showed a robust reduction in IHC synaptic density compared to their age-matched WT controls (Figure 9C, 9D, 9E–9H). Next, we used anti-myelin immunostaining to assess potential changes in SGN myelination. Semi-quantitative analyses of myelin and axonal thickness along the peripheral axons did not show statistical differences between WT and DKO mice before the onset of increased ABR thresholds (Figure 10; 1.5 mos (thickness in μm), WT = 1.5 ± 0.18 (n = 10), DKO = 1.5 ± 0.12 (n = 10); p = 0.56; 5 mos, WT= 1.4 ± 0.20 (n = 15), DKO = 1.4 ± 0.11 (n = 12); p = 0.89).
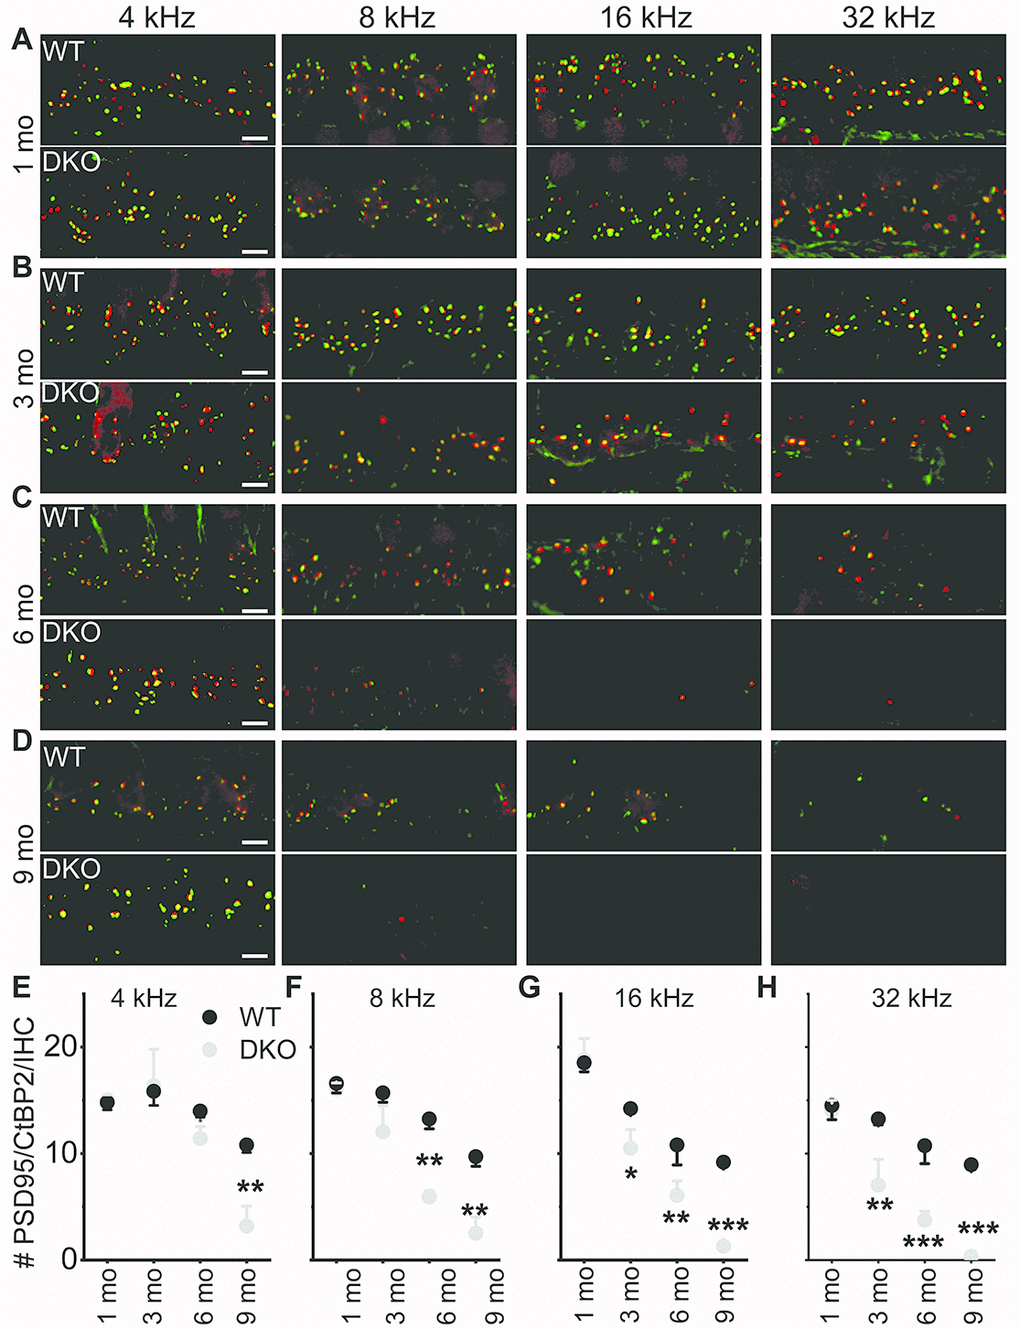
Figure 9. Presynaptic and postsynaptic marker counts are normal in KNa1 DKO in 1-3-, but not 6-9-mo old mice. Synapses between the spiral ganglion neurons (SGNs) and inner hair cells (IHCs) were quantified at four tonotopic locations (4, 8, 16, and 32 kHz) in the organ of Corti isolated from 1-9-mo old WT and DKO mice. (A–D) There were no obvious differences between WT and DKO mice in the organization of afferent synapses, identified as paired CtBP2 (red) and PSD95-(green) immunopuncta. Images presented as Z-projections were made using stacks of confocal micrographs from the 4, 8, 16, and 32 kHz region as indicated. (E–H) Quantification of the average number of synapses per IHC showed no statistically significant differences between WT (black) and DKO (grey) animals at 1 month of age. However, with increasing age from 3- to 9-mo, statistical differences among the synapse counts appeared and gradually encompassed more tonotopic regions. Statistical differences were observed first at the high-frequency segment of the cochlea. Values (mean ± SEM) are illustrated (p < 0.05, 0.01, 0.001 = *, **, ***). Scale bar = 3 μm.
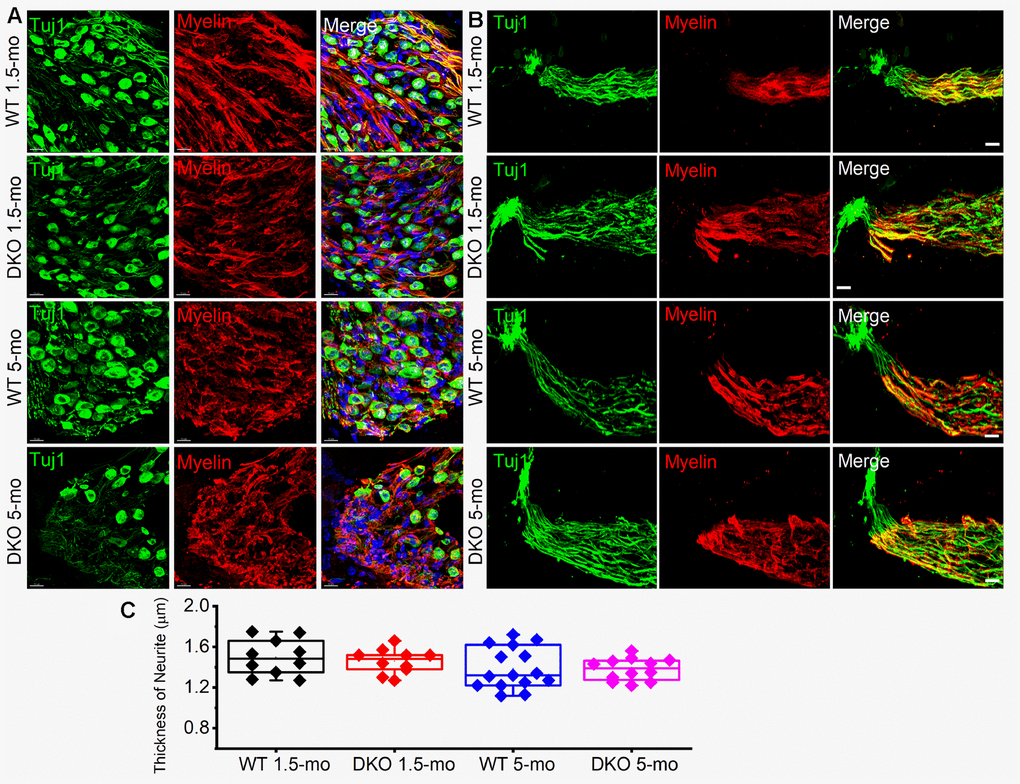
Figure 10. Myelin density and neurite thickness are unaltered in 1.5-5-old WT and DKO mice. (A) Sections of 1.5- and 5-mo-old WT and DKO spiral ganglion (SG) labeled with Tuj1 (green), and myelin (red) antibodies. Sections were obtained from the basal region of the cochlea. (B) Sections of 1.5 and 5-mo old WT and DKO peripheral neurites of SGN labeled as in (A). (C) Box plot of neurite thickness (diameter) at different age groups. Scale bar = 10 μm.
To account for SGN loss, we stained neurons with TUJ1 antibodies and sampled neuronal numbers from 1- to 9-mo-old mice. Synaptic and SGN loss was seen in 6-mo and older mice (Figure 11). SGN degeneration was preceded by a significant reduction in the soma size, as illustrated by measuring neuronal diameters (Figure 11). The demonstrable rise in Ca2+ can mediate SGN degeneration through multiple cell-death mechanisms [75, 39, 42]. To determine whether SGN loss found in the DKO mice resulted from apoptotic cell death, we used the TUNEL assay to determine neuronal survival (Figure 11). Using an antibody that specifically recognizes the cleaved form of caspase-3 (17 kDa), we analyzed sections of the SG of WT and DKO cochleae and detected caspase-3 activation by 5-mo of age (Figure 11A, 11B). There was no detectable cleaved caspase-3 in the SGN from 9-mo-old WT mice. Using an antibody that recognizes explicitly cleaved caspase-9, the activated 17-kDa fragment was detected in 5-mo old DKO mutant compared to WT SGNs (Figure 11C, 11D). Downstream caspases can be activated in the presence and absence of caspase-9 cleavage [43]. Increased TUNEL-positive SGN numbers were observed in 6-9 mo old DKO mice, as documented in the summary histograms (Figure 11E, 11H). For clarity in visualizing TUNEL-positive SGNs, we show photomicrographs without neuronal markers below (Figure 11E). Activation of caspases is transient and precedes apoptotic cell death. Induction of cleaved and activated caspases in the WT and DKO mutant SGNs were studied at survival times that preceded the robust loss of neurons (5 mo). The results raised the possibility that there might be stepwise transitions that culminate in morphological changes and neuronal loss in the DKO mice.
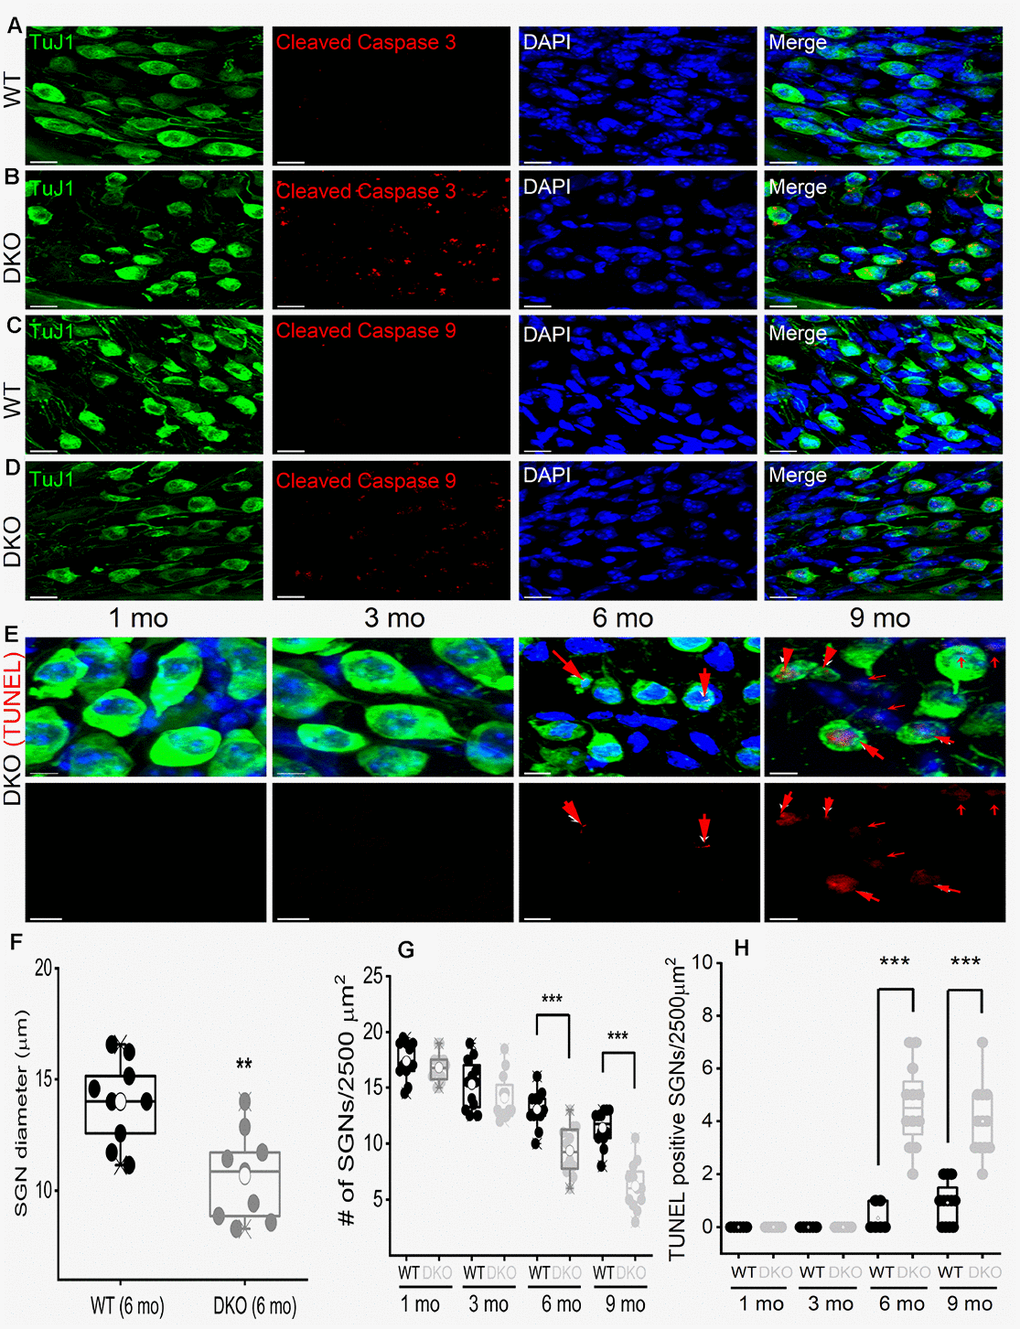
Figure 11. Age-related degeneration of SGN through apoptosis signal. (A–D) Immunofluorescence detection of cleaved caspase 3 (red; A–B) and caspase 9 (red; C, D) in WT and DKO 5-mo old cochlear sections. SGNs were labeled with neuronal marker TuJ1 (green). The nuclei were stained with DAPI (blue). Scale bar: 20 μm. Increased active caspase 3/9 was seen in DKO cochlear sections. Scale bar = 10 μm. (E) Shown are cochlear sections of in DKO cochleae at difference ages (1-9 mos) assessed for with TUNEL assay (TUNEL-positive in red). Scale bar: 5 μm. (F) Summary histogram showing a significant reduction in SGN size (diameter) between WT and DKO mice at 6-mo old (data from 9 mice each). (G) Age-dependent (1-9 mo) reduction in SGN densities (data from 8-9 mice each). Comparison between WT and DKO mice. (H) Summary data from WT and DKO cochleae at ages indicated, showing increased TUNEL-positive SGNs in 6-9–mo old (data from 8-9 mice each). Significant differences between genotypes were determined using unpaired two-tailed t-test (* p < 0.05, ** < 0.01, *** < 0.001).
SGN degeneration may be correlated with altered Ca2+ and inositol 1,4,5 trisphosphate receptor type 1 (IP3R1) signaling
Increased Ca2+ transients, as well as a delay in the bi-exponential kinetics of Ca2+ dynamics as observed in DKO SGNs (Figure 8), may be associated with overall alterations of Ca2+ homeostasis, including Ca2+ release from intracellular sources. Therefore, we determined whether altered IP3R1 regulatory mechanisms were involved in DKO SGN Ca2+ elevation compared to age-matched WT neurons, using IP3R1-specific antibodies to detect specific fragments of the protein (Figure 12), including 1) endoplasmic reticulum (ER) lumen region, 2) phosphorylation-site (pIPR1), 3) N-terminal binding (NIP3R1), and 4) cytoplasmic epitope (cleavage site overlap, IP3R1). Compared to WT SGNs, the levels of phosphorylated IP3R1 (pIP3R1) and N terminal fragment of IP3R1 (NIP3R1) were higher in the DKO at 1.5-mo and 5-mo old (Figure 12). Of note, by 5-mo, the levels of pIPR1 in WT and DKO SGNs were similar (not shown). However, qualitative assessment of antibody reactivity to the cytoplasmic epitope (1883 ~ 1902) that should react with the total IP3R1 suggested that the overall IP3R1 levels remain relatively unchanged (not shown). The results raise the possibility that DKO SGNs have increased N-terminal cytoplasmic fragments. Cleaved-IP3R1 (“leaky receptor”) is subjected to unregulated Ca2+ release that likely increases Ca2+ levels in DKO SGNs. However, further studies are required to demonstrate direct association between the rise in intracellular Ca2+ and IP3R1 signaling.
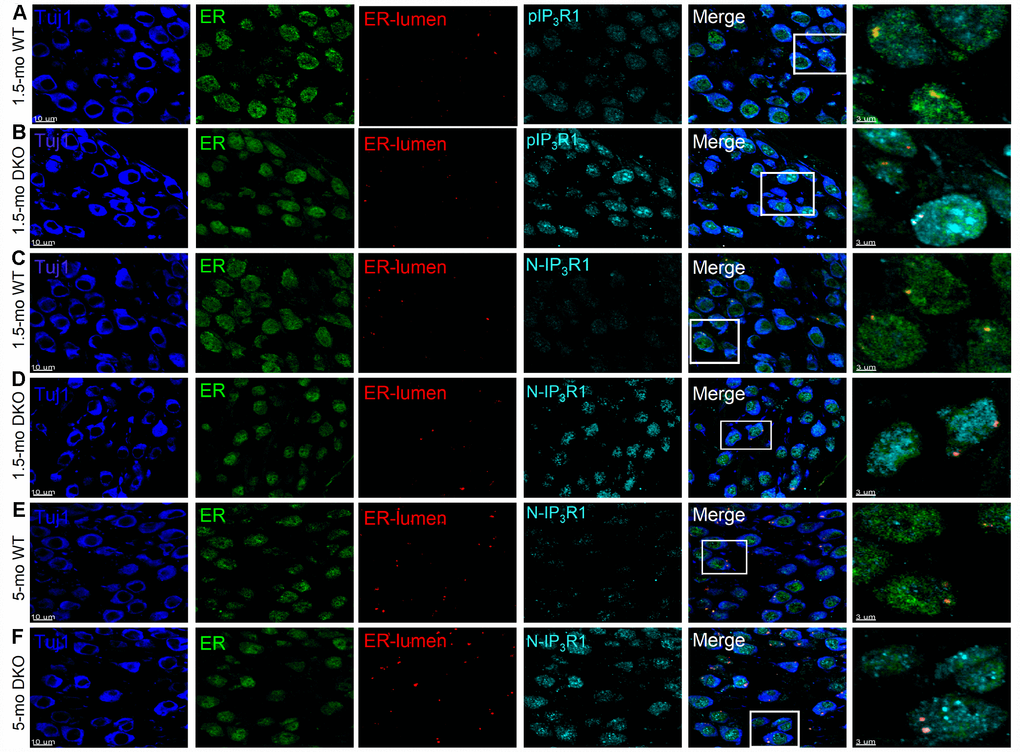
Figure 12. Detection of IP3R1, pIP3R1, and its proteolytic fragments in SGNs from WT and DKO cochlea. (A–F) Immunofluorescence detection of the endoplasmic reticulum (ER)-lumen domain of IP3R1(red), phosphorylation site (pIP3R1) (cyan; A–C), N-terminal domain (N-IP3R1) (cyan; C–F). We examined basal cochlear sections at 1.5-mo and 5-mo WT and DKO mice. SGNs were labeled with neuronal marker TuJ1 (blue). The ER was stained with ER-marker (blue). Merged images are shown together with digitally magnified (~3X) images, shown in the last panel. Scale bar 3 μm. For pIP3R1 at 1.5 mos, the percent of SGNs with positive reactivity for WT was 12 ± 3, and DKO was 54 ± 9; (p < 0.0001, data from 7 mice obtained from 25 section/mice). N-IP3R1 at 1.5- and 5-mos, percent cell reactivity for WT = 6 ± 3; DKO = 37 ± 12, and WT = 9 ± 4; DKO = 61 ± 12, respectively (p < 0.0001, data from 6 mice obtained from 25 section/mice). Scale bar = 10 μm.
Discussion
Peripheral axons/dendrites have segmental specializations, such as heminodes and node of Ranvier, interspersed with myelinated internodes for the initiation and saltatory conduction of APs. These vital roles are mediated by clustered subcellular expression of voltage-dependent Na+ and K+ channels at these privileged excitable domains [44, 45]. The importance of these ion channels and their site-specific location, as well as myelin in nerve conduction, is underpinned by neurological diseases, such as epilepsy [46] and multiple sclerosis [47], which are aligned with their mutations and demyelination. As it turns out, several of these diseases share HL as one of their symptoms. In the present study, we have discovered the axonal localization of KNa channel transcripts and identified a new role of KNa1 current, namely that this current is partially activated at rest (~20%) and is sustained at the RMP.
In contrast to the expected attenuation of a K+ current in membrane excitability, the resting activity of KNa1 in SGN enhances the availability of the transient Na+ current, increasing the upstroke phase of APs. Additionally, the interplay between the Na+ and KNa1 currents reduces membrane jitters in AP fidelity and delays, ensuring invariant timing of APs. The resulting altered AP phenotypes are expected to improve conduction speed and spike reliability [19], a requisite for normal auditory processing [35]. We demonstrated that the genetic ablation of Kcnt1/2 resulted in HHL that transitions gradually to overt HL, reminiscent of human HL [48]. In this model of Kcnt1/2 deletion, increased membrane excitability culminates with a gradual rise in intracellular Ca2+ and disruption in cytoplasmic Ca2+ handling. We propose that these changes may precipitate activation of caspases 3 and 9, leading to proteolytic fragmentation of IP3R1 and further activation of caspases to mediate apoptosis and resulting in SGN synaptic and somatic degeneration.
Robust expression of Kcnt1/2 transcripts and proteins in the axons and cell bodies of SGNs but not in hair cells
The expression of KNa1 is not restricted to SGNs and has been identified in the central AN, such as the MNTB, where KNa currents regulate spike timing [24, 25]. It is highly unlikely that the central role of the KNa current is responsible for the observed ABR peak I amplitude reduction and delayed latency, and the HHL, ensuing from the null deletion of Kcnt1 and Kcnt2. First, changes in ABR peak I latencies are impervious to altered central AN activity [49]. Second, alterations in the activities of neurons in the CN at the level of the MNTB are likely to affect peak III amplitudes and latencies. Third, both experimental and computational analyses have shown that ABR peak I originate exclusively from hair cells and SGN [38, 50]. Last, mature hair cells do not express functional Na+ currents, and in cases where the current has been identified, the voltage-dependent activation is extremely negative and falls outside the voltage ranges of the RMP of hair cells [51]. Therefore, KNa currents, if present in hair cells, are unlikely to have a functional impact. Furthermore, we did not find Kcnt1/2 transcripts and proteins in hair cells, ruling out the possibility that the observed HHL originated from hair cell dysfunction.
In contrast, SGNs show robust expression of Kcnt1/2 transcripts and channel proteins in the axons and cell bodies. Moreover, recent studies [21] and the present findings strongly suggest that the activity of KNa1/2 channels is essential for primary auditory functions. Thus, the most plausible explanation for the observed results is altered SGN functions, including synaptic, axonal conduction, and somatic dysfunction and degeneration.
RNA composition of subcellular compartments
Subcellular domain-specific RNA expression suggests enduring cellular processes occurring within that compartment. The use of RNA deep sequencing and high-resolution hybridization analyses have identified a plethora of mRNA species in neuronal axons and dendrites, including hippocampal CA1 neuropil, changing the prevailing notion of the capacity for mRNA localization and local protein translation [52–55]. Found predominantly as a developmental occurrence in the dynamic process at growth cones, β-actin and other structural protein mRNA were localized and translated in response to netrin I gradient in growth cones [56, 57]. Axoplasm extracts from giant axons have also been found to contain ribosomal RNA and transcripts that encode for protein-synthesis machinery proteins, indicating that local protein synthesis is a basic property of axons [33, 58, 59]. Indeed, axonal transcriptome from motoneurons and sensory neurons all contain membrane protein mRNA, including K+ channels [1, 60]. To our knowledge, this is the first report to demonstrate the expression of membrane protein transcripts encoding Kcnt1 and Kcnt2 in primary ANs. Consistent with the present report, immunostaining studies substantiated the expression of the channel proteins in the axolemma; although at present, we have no evidence to preclude that membrane protein, which is translated at the cell bodies, are shuttled to the axons. Nonetheless, our data suggest that SGNs may use structural and local domain-specific protein translation to confer multiple functions as described in central and peripheral neurons [1].
Multifaceted mechanisms of HHL
Hair cell-SGN afferent synaptic defects are one of the hallmarks of HHL. They are represented as degraded AN amplitude and latency responses and marked by pre- and post-synaptic marker mismatch and reduced synaptic densities [8, 12]. Disruption of myelination of peripheral axons of SGNs can also lead to HHL [3]. The present study suggests that there are no measurable changes in synaptic densities from the inception and the duration of the HHL phenotype in 1 and 3 months of age.
Additionally, using semi-qualitative and structural assessment of myelination between the WT and DKO mice SGNs, we did not identify any altered axonal myelination. The results argue against the contribution of structural defects in the underlying mechanisms of HHL in the mouse model. Instead, increased membrane jitters, reduced availability of Na+ currents and the resulting decline in the dV/dt of AP upstroke, and increased variability in spike timing introduced by ablation of KNa currents, are the likely functional aberrations, leading to the HHL phenotype. We interpret single AN electrophysiologic changes with great caution. Extending single-neuron properties to explain the ABR phenotype may be an oversimplification. However, it is reasonable to expect that the ensemble average of single neuronal activity represents the overall AN response property.
The role of KNa current in reducing membrane noise and the increased membrane jitters in the DKO SGNs can result in AP conduction failure and delays [19]. These are consistent with changes in peak I latencies between the WT and DKO ABR. Outward current mediated by KNa channels contributes to the setting of the RMP of SGNs. Activation of KNa current mediates membrane hyperpolarization that indirectly influences the steady-state available Nav channels. Increasing AP peak amplitude from membrane hyperpolarization is also expected to drive Ca2+ influx, regeneratively increasing the AP overshoot. Thus, a reduction in AP amplitude after the deletion of KNa channels dovetail well with the present report. Peak I amplitude of the ABR waveform originates from multiple sites of type I SGN afferents, including the unmyelinated post-synaptic terminal, the spike generator heminode [61], and saltatory conduction nodes of Ranvier. We propose that the resulting AP dyssynchronization and amplitude reduction, upon deletion of KNa current, are the underlying mechanisms for the loss of both amplitude and temporal resolution of the peak I ABR waveform. Since the peak I of the ABR waveform represents a gross afferent SGN discharge that originates from multiple sources and HHL is defined by an altered peak I profile, it is conceivable that there is a multifaceted etiology.
The transition from HHL to overt HL
Ca2+ has at least two competing effects on SGN functions. Moderate rises in Ca2+ promote SGN survival in vitro [62], whereas a sustained increase in Ca2+ mediates degenerative processes, including apoptotic cell death [75]. The findings suggest that KNa current, through sustained Na+ influx, draws the RMP towards hyperpolarized potentials, EK, which in turn increases available Na+ current for activation. KNa current attenuation likely mediates sufficient membrane depolarization of the RMP, reducing available Na+ current, which reduces not only the AP amplitude but also the rate of change of membrane voltage. We propose that sustained membrane depolarization in DKO SGNs may produce increased Ca2+ influx, triggering long-term aberrant Ca2+ handling, activation of caspase 3/9, and IP3R1 dysfunction and apoptotic neuronal degeneration. Indeed caspase 3 activation-mediated SGN degeneration has been demonstrated, and inhibition of caspase activity suffices to attenuate HL in mouse models [63]. Conformational changes ensuing from IP3 binding to IP3R1 mediate channel gating to release Ca2+ from the ER [64]. Proteolytic fragmentation of segments of the N-terminal cytoplasmic domain may favor prolonged open state, resulting in ER Ca2+ leakage that reinforces a rise in cytosolic Ca2+ [65].
Ion channel activity and changes in ion concentration are inexplicably linked to cellular viability and apoptotic cell death. Increased intracellular Ca2+ induces mitochondrial-dependent apoptosis [66, 67]. We show that altered Ca2+ level induced activation of caspase 3/9. Ca2+ and caspase-mediated cleavage of phosphorylated IP3R1 and truncated IP3R1 result in Ca2+ leakage to the cytoplasm from the ER. Increased cytosolic Ca2+ exerts positive feedback, stimulating mitochondria-mediated increase cleaved caspases [65, 68]. The findings provide definitive evidence to implicate the underlying Ca2+ dysfunctional cascade as a potential platform for SGNs degeneration. However, what remains unsolved is the complex interaction between Ca2+-dependent caspase activation and the initiation of the SGN degenerative process. Additionally, because Ca2+ signaling is at a bifurcation point between plasticity and cell death, the challenge is to determine the levels of Ca2+ and conditions that favor one of these major crossroads of neuronal activity for therapeutic intervention.
It is conceivable, albeit unlikely that potential compensatory changes ensuing from the null deletion of Kcnt1 and Kcnt2 may mask generalization of the findings on this report. The C57 background strain used as WT control belongs to a group of mouse strains that exhibit inherent ARHL [69]. Although the underlying mechanisms for the ARHL in mice have been assigned to the ahl1 allele, which represents cadherin 23 (hair bundle protein) mutation [70], using a WT control without this caveat (e.g., CBA/CaJ mouse model) would have been preferred. Also, direct synaptic recordings to determine KNa current functions in SGNs would substantiate conclusions gleaned from the present study. Finally, the interplay between Na+ and Ca2+-dependent regulations in ANs inferred from the present findings requires further examination.
Materials and Methods
The Animal Care and Ethical Committee of the University of Nevada Reno approved the use of animals in this study. All mice were bred in-house under a 12:12 h light-dark cycle. Wildtype (WT) and Kcnt1-/-/Kcnt2-/- (double knock out mutant (DKO mutant)) mice ages (1 to 9-months old) were used. Breeding pairs of the DKO mutants and the WT control mice were obtained from the laboratory of Dr. S. Pyott (University of Groningen). However, the mice originated from the laboratory of Dr. C. Lingle (Washington University, St. Louis) [23]. KNa1 double knockout (DKO) mice were bred onto a C57BL/6 background for 12 generations [23]. The utilization of wildtype (WT) littermates was not feasible. Thus, age and gender-matched C57BL/6 mice were obtained from the Jackson Laboratory and used as WT controls. The whole-genome scanning of the C57BL/6 (C57) and the DKO sub-strains was performed as described previously [21].
Auditory brainstem responses (ABR)
At least twelve WT, and ten DKO mutants, mice (grouped into age ranges; 1-, 3-, 6- and 9-month old) were anesthetized with ketamine (100 mg/kg) and xylazine (20 mg/kg) prior to recordings, and ABR measurements were recorded as described previously [71, 72]. Briefly, a ground needle electrode and recording needle were placed subcutaneously in the scalp, and a calibrated electrostatic speaker coupled to a hollow ear bar situated inside the external ear. Broadband clicks and pure tones (4, 8, 16, and 32 kHz) were presented in the animal’s ear in 10 dB increments, starting from 0 dB SPL and ending at 100 dB SPL. The ABR sweeps were computer-averaged (time-locked with the onset of 512 stimuli, at 20/s) out of the continuous electroencephalographic activity. The threshold of the hearing was determined as the lowest intensity of sound required to elicit a characteristic waveform. Peak (P)I and PII were detected manually in a blind faction to genotype and clicked sound and tone pips, to calculate wave I and II amplitudes and latencies. Input-output (I/O) function slopes of the amplitude and latency growth function curves were calculated as described previously [73] over stimulus intensities ranging from 10-100 dB SPL. I/O function slopes were determined when distinct positive and negative peaks could be identified unmistakably.
Single-molecule fluorescence in situ hybridization (smFISH) with RNAscope
Mice were anesthetized with an intraperitoneal injection of ketamine (100 mg/kg) and xylazine (20 mg/kg) and were transcardially perfused with diethyl pyrocarbonate (DEPC)-treated phosphate buffer saline (PBS) and 4% paraformaldehyde (PFA) in DEPC-treated-PBS to preserve RNA. Tissue samples from cochleae were harvested and kept in a 4% PFA in DEPC-treated solution, overnight on a shaker at 4°C. Samples were washed with DEPC-treated-PBS, and cochleae were decalcified in 10% ethylenediaminetetraacetic acid (EDTA) in DEPC-treated-PBS for 1-4 days, depending on the age of mice, on a shaker at 4°C and washed with DEPC-treated-PBS. Samples were sequentially dehydrated in 10%, 20%, and 30% sucrose solution at 4°C for 1 hr, 2 hrs, and overnight, respectively. Samples were transferred into optimal cutting temperature (OCT) compound for a minimum of 1 hr at 4°C and then snap frozen, using a dry ice-ethanol mixture. Samples were cryo-sectioned to a thickness of 14 μm, placed onto superfrost plus microscope slides, and stored at -80 °C until processed.
Probe hybridization was performed according to the manufacturer’s instructions (Advanced Cell Diagnostics, Newark, CA). Sections were immersed in pre-chilled 4% PFA for 15 min at 4°C. Sections were then dehydrated at room temperature (RT) in 50%, 70%, and twice in 100% ethanol for 5 min each and allowed to dry for 1-2 min. Fixation and dehydration were followed by hydrogen peroxide reaction for 10 min at room temperature (RT) then, protease digestion, using protease 4 for 30 min at RT. Sections were then incubated at 40°C with the following solutions: 1) target probe in probe diluent buffer for 2 hrs; 2) preamplifier in AMP 1 for 30 min; 3) amplifier in AMP 2 for 30 min; and 4) conjugation with dye-labeled probe in AMP 3 for 15 min; 5) the appropriate HRP-channel for 15 min; 6) Opal dye for fluorescent detection for 30 min; and 7) HRP blocker for 15 mins. After each step, slides were washed with buffer two times for 2 min at RT. Probes for K+ channels and glyceraldehyde 3-phosphate dehydrogenase (Gapdh) positive and blank negative controls were obtained from ACD. Sequences of the target probe, preamplifier, amplifier, and label probe are proprietary. Detailed information about the probe sequences can be obtained by signing a nondisclosure agreement provided by the manufacturer.
For subsequent immunofluorescent staining, slides were treated with 10% blocking solution for 30 min at RT, incubated with primary antibody (anti-β-III tubulin, TUJ1, Bio Legend, 1:500 dilution), overnight at 4°C, washed with TBS-0.005%Tween20 three times for 5 min each, incubated with secondary antibody (Alexa 594 and Alexa 647, Life Technologies, 1:500) for 2 hr at RT, and again washed with TBS-0.005%Tween20 three times for 5 min each. Incubation in DAPI solution for 30 s at RT was performed to label cell nuclei. Slides were then mounted in Fluoromount-G and sealed under a coverslip.
Immunofluorescence
Cochleae were dissected from the temporal bone and fixed in 4% PFA in PBS for 2 hr and processed sequentially with 10% EDTA for decalcification. Cochleae samples were sequentially dehydrated in 10%, 20%, and 30% sucrose solution at 4°C for 1 hr, 2 hr, and overnight, respectively, then embedded in OCT for cryosectioning in the modiolar plane. Sections of 10 μm were washed in PBS, permeabilized in PBST (0.1% Triton X-100 in PBS) for 25 min, and then incubated for 60 min in a blocking solution containing 1% bovine serum albumin (BSA) and 10% goat serum in PBST. The sections were incubated with each primary antibody in an antibody solution containing 3% goat serum in PBS overnight at 4°C. The rinsed sections were then incubated for 2 hr at RT in a fluorescent dye-conjugated secondary antibody. The following primary antibodies were used: rabbit anti-KCNT1, KCNT2 (Alomone, Jerusalem, Israel), rabbit anti-cleaved caspase-3 and -9 (Cell Signaling Technology, Danvers, MA), rabbit and mouse anti-myosin 7a (Proteus Biosciences, Novus Biological and Developmental Studies Hybridoma Bank (DSHB)) mouse anti-PSD95 (Millipore), mouse anti-CtBP2 (BD Biosciences, San Jose, CA), rabbit anti-active-caspase-9 and rabbit anti-active-caspase-3 (Abcam, Cambridge, MA), rabbit anti-N-IP3R1 (Biorbyt, San Francisco, CA) rabbit anti-pIP3R1 (Invitrogen, Carlsbad, CA), rabbit anti-IP3R1 (cleavage site, Novus Biologicals, Centennial, CO), rabbit anti-ER lumen IP3R1 (Sigma), rabbit anti-calnexin (ER marker, Abcam) and mouse anti-neuronal class III ß-Tubulin (TUJ1) (Covance, Princeton, NJ). Secondary antibodies were Alexa Fluor 488 goat anti-mouse IgG2a, Alexa Fluor 568 goat anti-mouse IgG1 (Life Technologies, Carlsbad, CA), fluorescein (FITC)-conjugated affinity-purified goat anti-rabbit IgG, Alexa Fluor 647 affinity-purified goat anti-mouse IgG, and Cy3-conjugated affinity-purified goat anti-mouse IgG (Jackson ImmunoResearch Laboratories, West Grove, PA). Images were captured with a Nikon A1 and Olympus FV1000 confocal microscope.
Isolation of SGNs and electrophysiological recordings
SGNs were isolated from male and female WT and DKO mice, as described in detail previously [74–77]. Mice were euthanized in a CO2 chamber, and the temporal bones were removed in a solution containing Minimum Essential Medium with Hank’s salt (Invitrogen), 0.2 g/L kynurenic acid, 10 mM MgCl2, 2% fetal bovine serum (FBS; v/v), and 6 g/L glucose. The SGN tissue was dissected and split into three equal segments: apical, middle, and basal turns across the modiolar axis. Apical and basal tissues were used to obtain viable neurons for patch-clamp experiments. Tissues were pooled from three mice into each SGN culture. Apical and basal tissues were digested separately in an enzyme mixture containing collagenase type I (1 mg/mL) and DNase (1 mg/mL) at 37 °C for 20 min. After a series of gentle trituration and centrifugation in 0.45 M sucrose, the cell pellets were reconstituted in 900 μl culture media (Neurobasal-A, supplemented with 2% B27 (v/v), 0.5 mM L-glutamine, 100 U/mL penicillin; Invitrogen) and filtered through a 20- μm cell strainer for cell culture. SGNs were cultured for 24 to 48 hrs to allow detachment of Schwann cells from neuronal membrane surfaces. All electrophysiological experiments were performed at RT (21-22°C). Tetrodotoxin (TTX) was applied at a perfusion rate of 1 ml/min for 5 min at a concentration of 10-1000 nM to block Na+ currents. Chemical reagents were obtained from Sigma-Aldrich (St. Louis, MO) unless otherwise noted. Other ionic currents such as K+ and Cl- currents were suppressed using K+ channel blockers and ion substitution.
Current and voltage-clamp experiments
Whole-cell membrane potential recordings were performed using an Axopatch 200B amplifier (Molecular Devices, Sunnyvale, CA). Membrane potentials were amplified, bandpass filtered (2-10 kHz), and digitized at 5-50 kHz using an analog-to-digital converter (Digidata 1200, Molecular Devices) as described earlier [78, 79]. Electrodes (2-3 MΩ) were pulled from borosilicate glass pipettes, and the tips were fire-polished. The normal extracellular/bath solution consisted of (in mM) 130 NaCl, 5 KCl, 1 MgCl2, 2 CaCl2, 10 D-glucose, and 10 4-(2-hydroxyethyl)-1-piperazineethanesulfonic acid (HEPES), pH 7.3. The normal internal/pipette/ solution contained (in mM) 132 KCl, 1 MgCl2, 0.01 CaCl2, 2 ethylene glycol-bis(β-aminoethyl ether)-N,N,N′,N′-tetraacetic acid (EGTA) 5 ATP-K2, and 10 HEPES, pH 7.3. The seal resistance was typically 5-10 GΩ. Capacitance and series resistance compensation (>90%) were made, and traces were filtered at 2 kHz using an 8-pole Bessel filter and sampled at 5 kHz. The liquid junction potentials (LJP) were measured (2.1 + 1.2 mV; n = 87) and corrected as described previously [80]. Data analyses were performed using the pClamp and Origin software (MicroCal Inc., Northampton, MA). Where appropriate, pooled data are presented as means + S.D.
Whole-cell voltage-clamp recordings were conducted at RT, using an Axopatch 200B amplifier and filtered at 2 kHz through a low-pass Bessel filter. Data were digitized at 0.5-1.0 kHz using a Digi-data analog-to-digital converter. SGNs, after 1-2 days in culture, was held in a bath solution (in mM; 4 KCl, 2 MgCl2, 0.1 CaCl2, 10 HEPES, 10 D-glucose, 75 NaCl, 50 N-methyl glucamine, 20 tetraethylammonium chloride (TEACl), and 5 4-Aminopyridine (4-AP)). The bath solution composition curbed K+ currents. We suppressed Ca2+ and Cl- currents by using 0.05 mM bath Ca2+ and replacing 90 mM bath Cl- and pipette solution with aspartate. Replacing Cl- with aspartate increased the LJP by 9.5 + 1.8 mV (n = 36), which was corrected. Borosilicate glass pipettes were pulled using a Sutter P-97 Flaming-Brown micropipette puller (Sutter Instruments) and fire-polished for an optimal pipette resistance (2-3 MΩ). Pipettes were backfilled with an internal solution (in mM; 2.5 EGTA, 95 NMGCl, 5 NaCl, 10 CsCl, 2 MgCl2, 0.1 CaCl2, 10 HEPES, 5 ATP-bis(tris), and 5 glutathione). Data were considered for analyses if the seal resistance was greater than 2 GΩ, and access resistance was less than 7 MΩ.
After achieving a gigaohm seal, gentle suction was applied to form a whole-cell configuration. A holding potential of -110 mV was applied to all protocols to prime Na+ currents for activation. Activation was analyzed with depolarizing voltage steps from -70 to 60 mV, using a ΔV of 2.5 mV. Inactivation was studied using a standard protocol and range of pre-pulse from -110 to 60 mV, using a ΔV of 5 mV. All protocols employed p/n (n = 7) leak subtraction at the holding potential.
Confocal Ca2+ imaging and measurement of SGNs
Isolated SGNs were loaded with the Ca2+ indicator Fluo 4-AM, following the manufacturer’s protocol (ThermoFisher Scientific, Waltham, MA) to monitor intracellular Ca2+ under a confocal microscope (Zeiss LSM 700). A line-scan was performed to measure the relative Ca2+ concentration across the SGN. Time-lapse recordings were performed to measure the dynamic changes of Ca2+ concentration in the selected region. Confocal line-scan imaging was performed by using a confocal microscope equipped with an argon laser (488 nm) and a 40X oil immersion objective lens (N.A., 1.3). Line-scan images were acquired at sampling rates of 0.7 ms per line and 0.07 μm per pixel, with radial and axial resolutions of 0.4 and 1.0 μm, respectively. Ca2+ transients were expressed as the normalized local fluorescence (F/Fo), where Fo refers to the baseline fluorescence.
For cellular Ca2+ concentration measurements, we use the IonOptix Ca2+ measuring system (IonOptix LLC, Westwood, MA). SGNs were first loaded with Fura-2 (Thermo Fisher). After baseline recordings, the SGNs were stimulated by a continuous 10 V bipolar square pulse with 2 ms width at a frequency of 4 Hz. Cells were continuously perfused during the bath recordings solution. The 340/380 excitation ratio was recorded to determine the intracellular Ca2+ concentration changes.
Statistical analyses
Where appropriate, pooled data are presented as means ± SD. Significant differences between groups were tested using t-test and ANOVA, where applicable. The null hypothesis was rejected when the two-tailed p-value < 0.05 is indicated with *, < 0.01 with **, < with ***. The number of mice and neurons are reported as n.
Author Contributions
E.N.Y and N.C designed the research, M.C.P.F., J.H.L, S.P, M.K, X.Z, W.W, N.C, and E.N.Y., analyzed data and wrote the manuscript; M.C.P.F., J.H.L., M.K, X.Z, W.W, N.C, and E.N.Y., performed the research. All authors read and approved the final manuscript.
Acknowledgments
We thank members of our laboratory for comments on this manuscript.
Conflicts of Interest
The authors have no conflicts of interests to declare.
Funding
This work was supported by grants to E.N.Y. from the National Institutes of Health (DC016099, DC05135, and AG051443, DC015252, AG060504). The project was supported by grants from the National Institutes of Health (P01 AG051443, R01 DC015135, DC016099, DC015252, and R01 AG060504) to E. N. Y.
References
- 1. Holt CE, Schuman EM. The central dogma decentralized: new perspectives on RNA function and local translation in neurons. Neuron. 2013; 80:648–57. https://doi.org/10.1016/j.neuron.2013.10.036 [PubMed]
- 2. Corcoran AJ, Moss CF. Sensing in a noisy world: lessons from auditory specialists, echolocating bats. J Exp Biol. 2017; 220:4554–66. https://doi.org/10.1242/jeb.163063 [PubMed]
- 3. Wan G, Corfas G. Transient auditory nerve demyelination as a new mechanism for hidden hearing loss. Nat Commun. 2017; 8:14487. https://doi.org/10.1038/ncomms14487 [PubMed]
- 4. Olusanya BO, Neumann KJ, Saunders JE. The global burden of disabling hearing impairment: a call to action. Bull World Health Organ. 2014; 92:367–73. https://doi.org/10.2471/BLT.13.128728 [PubMed]
- 5. Hind SE, Haines-Bazrafshan R, Benton CL, Brassington W, Towle B, Moore DR. Prevalence of clinical referrals having hearing thresholds within normal limits. Int J Audiol. 2011; 50:708–16. https://doi.org/10.3109/14992027.2011.582049 [PubMed]
- 6. Ng CW, Navarro X, Engle JR, Recanzone GH. Age-related changes of auditory brainstem responses in nonhuman primates. J Neurophysiol. 2015; 114:455–67. https://doi.org/10.1152/jn.00663.2014 [PubMed]
- 7. Grinn SK, Wiseman KB, Baker JA, Le Prell CG. Hidden Hearing Loss? No Effect of Common Recreational Noise Exposure on Cochlear Nerve Response Amplitude in Humans. Front Neurosci. 2017; 11:465. https://doi.org/10.3389/fnins.2017.00465 [PubMed]
- 8. Sergeyenko Y, Lall K, Liberman MC, Kujawa SG. Age-related cochlear synaptopathy: an early-onset contributor to auditory functional decline. J Neurosci. 2013; 33:13686–94. https://doi.org/10.1523/JNEUROSCI.1783-13.2013 [PubMed]
- 9. Mehraei G, Hickox AE, Bharadwaj HM, Goldberg H, Verhulst S, Liberman MC, Shinn-Cunningham BG. Auditory Brainstem Response Latency in Noise as a Marker of Cochlear Synaptopathy. J Neurosci. 2016; 36:3755–64. https://doi.org/10.1523/JNEUROSCI.4460-15.2016 [PubMed]
- 10. Kujawa SG, Liberman MC. Adding insult to injury: cochlear nerve degeneration after "temporary" noise-induced hearing loss. J Neurosci. 2009; 29:14077–85. https://doi.org/10.1523/JNEUROSCI.2845-09.2009 [PubMed]
- 11. Schaette R, McAlpine D. Tinnitus with a normal audiogram: physiological evidence for hidden hearing loss and computational model. J Neurosci. 2011; 31:13452–7. https://doi.org/10.1523/JNEUROSCI.2156-11.2011 [PubMed]
- 12. Kujawa SG, Liberman MC. Synaptopathy in the noise-exposed and aging cochlea: Primary neural degeneration in acquired sensorineural hearing loss. Hear Res. 2015; 330:191–9. https://doi.org/10.1016/j.heares.2015.02.009 [PubMed]
- 13. Nienhuys TG, Clark GM. Frequency discrimination following the selective destruction of cochlear inner and outer hair cells. Science. 1978; 199:1356–7. [PubMed]
- 14. Zhang KD, Coate TM. Recent advances in the development and function of type II spiral ganglion neurons in the mammalian inner ear. Semin Cell Dev Biol. 2017; 65:80–7. https://doi.org/10.1016/j.semcdb.2016.09.017 [PubMed]
- 15. Sheets L, Hagen MW, Nicolson T. Characterization of Ribeye subunits in zebrafish hair cells reveals that exogenous Ribeye B-domain and CtBP1 localize to the basal ends of synaptic ribbons. PloS one. 2014; 9:e107256. https://doi.org/10.1371/journal.pone.0107256 [PubMed]
- 16. Glowatzki E, Fuchs PA. Transmitter release at the hair cell ribbon synapse. Nat Neurosci. 2002; 5:147–54. https://doi.org/10.1038/nn796 [PubMed]
- 17. Ruel J, Bobbin RP, Vidal D, Pujol R, Puel JL. The selective AMPA receptor antagonist GYKI 53784 blocks action potential generation and excitotoxicity in the guinea pig cochlea. Neuropharmacology. 2000; 39:1959–73. [PubMed]
- 18. Browne L, Smith KE, Jagger DJ. Identification of Persistent and Resurgent Sodium Currents in Spiral Ganglion Neurons Cultured from the Mouse Cochlea. eNeuro. 2017; 4. https://doi.org/10.1523/ENEURO.0303-17.2017 [PubMed]
- 19. Kim JH, Renden R, von Gersdorff H. Dysmyelination of auditory afferent axons increases the jitter of action potential timing during high-frequency firing. J Neurosci. 2013; 33:9402–7. https://doi.org/10.1523/JNEUROSCI.3389-12.2013 [PubMed]
- 20. Rattay F, Lutter P, Felix H. A model of the electrically excited human cochlear neuron. I. Contribution of neural substructures to the generation and propagation of spikes. Hear Res. 2001; 153:43–63. [PubMed]
- 21. Reijntjes DOJ, Lee JH, Park S, Schubert NMA, van Tuinen M, Vijayakumar S, Jones TA, Jones SM, Gratton MA, Xia XM, Yamoah EN, Pyott SJ. Sodium-activated potassium channels shape peripheral auditory function and activity of the primary auditory neurons in mice. Sci Rep. 2019; 9:2573. https://doi.org/10.1038/s41598-019-39119-z [PubMed]
- 22. Kaczmarek LK. Slack, Slick and Sodium-Activated Potassium Channels. ISRN Neurosci. 2013; 2013. https://doi.org/10.1155/2013/354262 [PubMed]
- 23. Martinez-Espinosa PL, Wu J, Yang C, Gonzalez-Perez V, Zhou H, Liang H, Xia XM, Lingle CJ. Knockout of Slo2.2 enhances itch, abolishes KNa current, and increases action potential firing frequency in DRG neurons. Elife. 2015; 4. https://doi.org/10.7554/eLife.10013 [PubMed]
- 24. Yang B, Desai R, Kaczmarek LK. Slack and Slick K(Na) channels regulate the accuracy of timing of auditory neurons. J Neurosci. 2007; 27:2617–27. https://doi.org/10.1523/JNEUROSCI.5308-06.2007 [PubMed]
- 25. Bhattacharjee A, Gan L, Kaczmarek LK. Localization of the Slack potassium channel in the rat central nervous system. J Comp Neurol. 2002; 454:241–54. https://doi.org/10.1002/cne.10439 [PubMed]
- 26. Tomasello DL, Hurley E, Wrabetz L, Bhattacharjee A. Slick (Kcnt2) Sodium-Activated Potassium Channels Limit Peptidergic Nociceptor Excitability and Hyperalgesia. J Exp Neurosci. 2017; 11:1179069517726996. https://doi.org/10.1177/1179069517726996 [PubMed]
- 27. Bischoff U, Vogel W, Safronov BV. Na+-activated K+ channels in small dorsal root ganglion neurones of rat. J Physiol. 1998; 510:743–54. [PubMed]
- 28. Yoon BC, Jung H, Dwivedy A, O'Hare CM, Zivraj KH, Holt CE. Local translation of extranuclear lamin B promotes axon maintenance. Cell. 2012; 148:752–64. https://doi.org/10.1016/j.cell.2011.11.064 [PubMed]
- 29. Aakalu G, Smith WB, Nguyen N, Jiang C, Schuman EM. Dynamic visualization of local protein synthesis in hippocampal neurons. Neuron. 2001; 30:489–502. [PubMed]
- 30. Huber KM, Kayser MS, Bear MF. Role for rapid dendritic protein synthesis in hippocampal mGluR-dependent long-term depression. Science. 2000; 288:1254–7. [PubMed]
- 31. Kang H, Schuman EM. A requirement for local protein synthesis in neurotrophin-induced hippocampal synaptic plasticity. Science. 1996; 273:1402–6. [PubMed]
- 32. Martin KC, Casadio A, Zhu H, Yaping E, Rose JC, Chen M, Bailey CH, Kandel ER. Synapse-specific, long-term facilitation of aplysia sensory to motor synapses: a function for local protein synthesis in memory storage. Cell. 1997; 91:927–38. [PubMed]
- 33. Mathur C, Johnson KR, Tong BA, Miranda P, Srikumar D, Basilio D, Latorre R, Bezanilla F, Holmgren M. Demonstration of ion channel synthesis by isolated squid giant axon provides functional evidence for localized axonal membrane protein translation. Sci Rep. 2018; 8:2207. https://doi.org/10.1038/s41598-018-20684-8 [PubMed]
- 34. Hossain WA, Antic SD, Yang Y, Rasband MN, Morest DK. Where is the spike generator of the cochlear nerve? Voltage-gated sodium channels in the mouse cochlea. J Neurosci. 2005; 25:6857–68. https://doi.org/10.1523/JNEUROSCI.0123-05.2005 [PubMed]
- 35. Li GL, Cho S, von Gersdorff H. Phase-locking precision is enhanced by multiquantal release at an auditory hair cell ribbon synapse. Neuron. 2014; 83:1404–17. https://doi.org/10.1016/j.neuron.2014.08.027 [PubMed]
- 36. Matsushima J. [Origin of N1 wave of the cochlear nerve action potential recorded at the bony wall of the cochlea]. Hokkaido Igaku Zasshi. 1982; 57:602–13. [PubMed]
- 37. Brown DJ, Patuzzi RB. Evidence that the compound action potential (CAP) from the auditory nerve is a stationary potential generated across dura mater. Hear Res. 2010; 267:12–26. https://doi.org/10.1016/j.heares.2010.03.091 [PubMed]
- 38. Rattay F, Danner SM. Peak I of the human auditory brainstem response results from the somatic regions of type I spiral ganglion cells: evidence from computer modeling. Hear Res. 2014; 315:67–79. https://doi.org/10.1016/j.heares.2014.07.001 [PubMed]
- 39. Frisina RD, Ding B, Zhu X, Walton JP. Age-related hearing loss: prevention of threshold declines, cell loss and apoptosis in spiral ganglion neurons. Aging (Albany NY). 2016; 8:2081–99. https://doi.org/10.18632/aging.101045 [PubMed]
- 40. Frisina RD, Zhu X. Auditory sensitivity and the outer hair cell system in the CBA mouse model of age-related hearing loss. Open Access Anim Physiol. 2010; 2:9–16. https://doi.org/10.2147/OAAP.S7202 [PubMed]
- 41. Makary CA, Shin J, Kujawa SG, Liberman MC, Merchant SN. Age-related primary cochlear neuronal degeneration in human temporal bones. J Assoc Res Otolaryngol. 2011; 12:711–7. https://doi.org/10.1007/s10162-011-0283-2 [PubMed]
- 42. Someya S, Xu J, Kondo K, Ding D, Salvi RJ, Yamasoba T, Rabinovitch PS, Weindruch R, Leeuwenburgh C, Tanokura M, Prolla TA. Age-related hearing loss in C57BL/6J mice is mediated by Bak-dependent mitochondrial apoptosis. Proc Natl Acad Sci U S A. 2009; 106:19432–7. https://doi.org/10.1073/pnas.0908786106 [PubMed]
- 43. Stennicke HR, Salvesen GS. Catalytic properties of the caspases. Cell Death Differ. 1999; 6:1054–9. https://doi.org/10.1038/sj.cdd.4400599 [PubMed]
- 44. Kole MH, Stuart GJ. Signal processing in the axon initial segment. Neuron. 2012; 73:235–47. https://doi.org/10.1016/j.neuron.2012.01.007 [PubMed]
- 45. Rasband MN. The axon initial segment and the maintenance of neuronal polarity. Nat Rev Neurosci. 2010; 11:552–62. https://doi.org/10.1038/nrn2852 [PubMed]
- 46. Smart SL, Lopantsev V, Zhang CL, Robbins CA, Wang H, Chiu SY, Schwartzkroin PA, Messing A, Tempel BL. Deletion of the K(V)1.1 potassium channel causes epilepsy in mice. Neuron. 1998; 20:809–19. [PubMed]
- 47. Mandolesi G, Gentile A, Musella A, Fresegna D, De Vito F, Bullitta S, Sepman H, Marfia GA, Centonze D.. Synaptopathy connects inflammation and neurodegeneration in multiple sclerosis. Nat Rev Neurol. 2015; 11:711–24. https://doi.org/10.1038/nrneurol.2015.222 [PubMed]
- 48. Liberman MC, Kujawa SG. Cochlear synaptopathy in acquired sensorineural hearing loss: Manifestations and mechanisms. Hear Res. 2017; 349:138–47. https://doi.org/10.1016/j.heares.2017.01.003 [PubMed]
- 49. Maison SF, Usubuchi H, Liberman MC. Efferent feedback minimizes cochlear neuropathy from moderate noise exposure. J Neurosci. 2013; 33:5542–52. https://doi.org/10.1523/JNEUROSCI.5027-12.2013 [PubMed]
- 50. Hashimoto I. Auditory evoked potentials recorded directly from the human VIIIth nerve and brain stem: origins of their fast and slow components. Electroencephalogr Clin Neurophysiol Suppl. 1982; 36:305–14. [PubMed]
- 51. Wooltorton JR, Gaboyard S, Hurley KM, Price SD, Garcia JL, Zhong M, Lysakowski A, Eatock RA. Developmental changes in two voltage-dependent sodium currents in utricular hair cells. J Neurophysiol. 2007; 97:1684–704. https://doi.org/10.1152/jn.00649.2006 [PubMed]
- 52. Cajigas IJ, Tushev G, Will TJ, tom Dieck S, Fuerst N, Schuman EM. The local transcriptome in the synaptic neuropil revealed by deep sequencing and high-resolution imaging. Neuron. 2012; 74:453–66. https://doi.org/10.1016/j.neuron.2012.02.036 [PubMed]
- 53. Poon MM, Choi SH, Jamieson CA, Geschwind DH, Martin KC. Identification of process-localized mRNAs from cultured rodent hippocampal neurons. J Neurosci. 2006; 26:13390–9. https://doi.org/10.1523/JNEUROSCI.3432-06.2006 [PubMed]
- 54. Swanger SA, He YA, Richter JD, Bassell GJ. Dendritic GluN2A synthesis mediates activity-induced NMDA receptor insertion. J Neurosci. 2013; 33:8898–908. https://doi.org/10.1523/JNEUROSCI.0289-13.2013 [PubMed]
- 55. Alvarez J, Giuditta A, Koenig E. Protein synthesis in axons and terminals: significance for maintenance, plasticity and regulation of phenotype. With a critique of slow transport theory. Prog Neurobiol. 2000; 62:1–62. [PubMed]
- 56. Leung KM, van Horck FP, Lin AC, Allison R, Standart N, Holt CE. Asymmetrical beta-actin mRNA translation in growth cones mediates attractive turning to netrin-1. Nat Neurosci. 2006; 9:1247–56. https://doi.org/10.1038/nn1775 [PubMed]
- 57. Giuditta A, Kaplan BB, van Minnen J, Alvarez J, Koenig E. Axonal and presynaptic protein synthesis: new insights into the biology of the neuron. Trends Neurosci. 2002; 25:400–4. [PubMed]
- 58. Giuditta A, Cupello A, Lazzarini G. Ribosomal RNA in the axoplasm of the squid giant axon. J Neurochem. 1980; 34:1757–60. https://doi.org/10.1111/j.1471-4159.1980.tb11271.x [PubMed]
- 59. Taylor AM, Berchtold NC, Perreau VM, Tu CH, Li Jeon N, Cotman CW. Axonal mRNA in uninjured and regenerating cortical mammalian axons. J Neurosci. 2009; 29:4697–707. https://doi.org/10.1523/JNEUROSCI.6130-08.2009 [PubMed]
- 60. Jung H, Yoon BC, Holt CE. Axonal mRNA localization and local protein synthesis in nervous system assembly, maintenance and repair. Nat Rev Neurosci. 2012; 13:308–24. https://doi.org/10.1038/nrn3210 [PubMed]
- 61. Kim KX, Rutherford MA. Maturation of NaV and KV Channel Topographies in the Auditory Nerve Spike Initiator before and after Developmental Onset of Hearing Function. J Neurosci. 2016; 36:2111–8. https://doi.org/10.1523/JNEUROSCI.3437-15.2016 [PubMed]
- 62. Bok J, Wang Q, Huang J, Green SH. CaMKII and CaMKIV mediate distinct prosurvival signaling pathways in response to depolarization in neurons. Mol Cell Neurosci. 2007; 36:13–26. https://doi.org/10.1016/j.mcn.2007.05.008 [PubMed]
- 63. Yang L, Zhang H, Han X, Zhao X, Hu F, Li P, Xie G, Gao L, Cheng L, Song X, Han F. Attenuation of hearing loss in DBA/2J mice by anti-apoptotic treatment. Hear Res. 2015; 327:109–16. https://doi.org/10.1016/j.heares.2015.05.006 [PubMed]
- 64. Alzayady KJ, Wang L, Chandrasekhar R, Wagner LE
2nd , Van Petegem F, Yule DI. Defining the stoichiometry of inositol 1,4,5-trisphosphate binding required to initiate Ca2+ release. Sci Signal. 2016; 9:ra35. https://doi.org/10.1126/scisignal.aad6281 [PubMed] - 65. Wang L, Alzayady KJ, Yule DI. Proteolytic fragmentation of inositol 1,4,5-trisphosphate receptors: a novel mechanism regulating channel activity? J Physiol. 2016; 594:2867–76. https://doi.org/10.1113/JP271140 [PubMed]
- 66. Arrebola F, Zabiti S, Canizares FJ, Cubero MA, Crespo PV, Fernandez-Segura E. Changes in intracellular sodium, chlorine, and potassium concentrations in staurosporine-induced apoptosis. J Cell Physiol. 2005; 204:500–7. https://doi.org/10.1002/jcp.20306 [PubMed]
- 67. Kondratskyi A, Kondratska K, Skryma R, Prevarskaya N. Ion channels in the regulation of apoptosis. Biochim Biophys Acta. 2015; 1848:2532–46. https://doi.org/10.1016/j.bbamem.2014.10.030 [PubMed]
- 68. Lencesova L, Krizanova O. IP(3) receptors, stress and apoptosis. Gen Physiol Biophys. 2012; 31:119–30. https://doi.org/10.4149/gpb_2012_014 [PubMed]
- 69. Zheng QY, Johnson KR, Erway LC. Assessment of hearing in 80 inbred strains of mice by ABR threshold analyses. Hear Res. 1999; 130:94–107. [PubMed]
- 70. Johnson KR, Tian C, Gagnon LH, Jiang H, Ding D, Salvi R. Effects of Cdh23 single nucleotide substitutions on age-related hearing loss in C57BL/6 and 129S1/Sv mice and comparisons with congenic strains. Sci Rep. 2017; 7:44450. https://doi.org/10.1038/srep44450 [PubMed]
- 71. Diaz RC, Vazquez AE, Dou H, Wei D, Cardell EL, Lingrel J, Shull GE, Doyle KJ, Yamoah EN. Conservation of hearing by simultaneous mutation of Na,K-ATPase and NKCC1. J Assoc Res Otolaryngol. 2007; 8:422–34. https://doi.org/10.1007/s10162-007-0089-4 [PubMed]
- 72. Dou H, Vazquez AE, Namkung Y, Chu H, Cardell EL, Nie L, Parson S, Shin HS, Yamoah EN. Null mutation of alpha1D Ca2+ channel gene results in deafness but no vestibular defect in mice. J Assoc Res Otolaryngol. 2004; 5:215–26. https://doi.org/10.1007/s10162-003-4020-3 [PubMed]
- 73. Caberlotto E, Michel V, Foucher I, Bahloul A, Goodyear RJ, Pepermans E, Michalski N, Perfettini I, Alegria-Prévot O, Chardenoux S, Do Cruzeiro M, Hardelin JP, Richardson GP, Avan P, Weil D, Petit C. Usher type 1G protein sans is a critical component of the tip-link complex, a structure controlling actin polymerization in stereocilia. Proc Natl Acad Sci U S A. 2011; 108:5825–30. https://doi.org/10.1073/pnas.1017114108 [PubMed]
- 74. Lv P, Sihn CR, Wang W, Shen H, Kim HJ, Rocha-Sanchez SM, Yamoah EN. Posthearing Ca(2+) currents and their roles in shaping the different modes of firing of spiral ganglion neurons. J Neurosci. 2012; 32:16314–30. https://doi.org/10.1523/JNEUROSCI.2097-12.2012 [PubMed]
- 75. Lv P, Wei D, Yamoah EN. Kv7-type channel currents in spiral ganglion neurons: involvement in sensorineural hearing loss. J Biol Chem. 2010; 285:34699–707. https://doi.org/10.1074/jbc.M110.136192 [PubMed]
- 76. Wang W, Kim HJ, Lee JH, Wong V, Sihn CR, Lv P, Perez Flores MC, Mousavi-Nik A, Doyle KJ, Xu Y, Yamoah EN. Functional Significance of K+ Channel beta-Subunit KCNE3 in Auditory Neurons. J Biol Chem. 2014; 289:16802–13. https://doi.org/10.1074/jbc.M113.545236 [PubMed]
- 77. Lee JH, Sihn C, Wang W, Flores CM, Yamoah EN. In Vitro Functional Assessment of Adult Spiral Ganglion Neurons (SGNs). Methods Mol Biol. 2016; 1427:513–23. https://doi.org/10.1007/978-1-4939-3615-1_29 [PubMed]
- 78. Rodriguez-Contreras A, Lv P, Zhu J, Kim HJ, Yamoah EN. Effects of strontium on the permeation and gating phenotype of calcium channels in hair cells. J Neurophysiol. 2008; 100:2115–24. https://doi.org/10.1152/jn.90473.2008 [PubMed]
- 79. Levic S, Nie L, Tuteja D, Harvey M, Sokolowski BH, Yamoah EN. Development and regeneration of hair cells share common functional features. Proc Natl Acad Sci U S A. 2007; 104:19108–13. https://doi.org/10.1073/pnas.0705927104 [PubMed]
- 80. Rodriguez-Contreras A, Yamoah EN. Direct measurement of single-channel Ca(2+) currents in bullfrog hair cells reveals two distinct channel subtypes. J Physiol. 2001; 534:669–89. [PubMed]