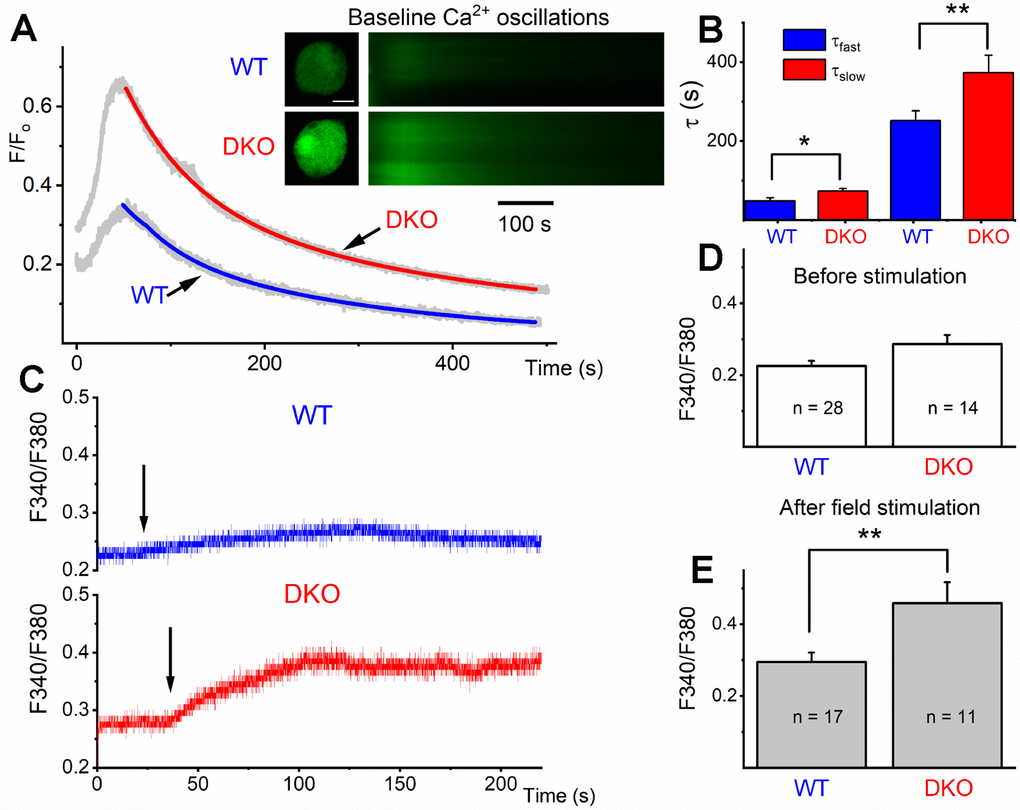
Figure 8.Ca2+ transients in 1-mo old SGNs from WT and DKO mice. (A) Representative examples of line-scan images (inset) captured from unstimulated but spontaneous Ca2+ oscillations showing Ca2+ transients recorded from WT (upper panel, in black) and DKO (lower panel, in gray) SGNs. Sample records show SGN loaded with Fluo 4. (B) Summary data for the fast and slow time constant (τ1 and τ2) of the Ca2+ transient decay at baseline using two exponential functions. The τ1 (ms) for WT = 48.4 ± 7.9; DKO = 73.2 ± 6.3; n = 19 (p = 0.019): and τ2 (ms) for WT = 251.7 ± 24.5; DKO = 373.3 ± 44.2; n = 17 (p = 0.022). (C) Sample records show a region of interest (ROI) of ratiometric Fura 2 assessment of field potential (10V/4Hz) depolarization of WT and DKO SGN (arrows show the time of stimulation). Recovery after field stimulation had ~500-1000s time course (not shown). (D, E) Summary data for the amplitude of the total Ca2+ at baseline and after field stimulation in WT and DKO SGNs (1-mo old apical neurons). The F340/380 for WT before field stimulation = 0.23 ± 0.01 (n = 28); DKO = 0.29 ± 0.03; n = 14 (p = 0.029): and after field stimulation WT = 0.29 ± 0.03 (n = 17); DKO = 0.46 ± 0.06; n = 11 (p = 0.007). Significant differences between genotypes were determined using unpaired two-tailed t-test.