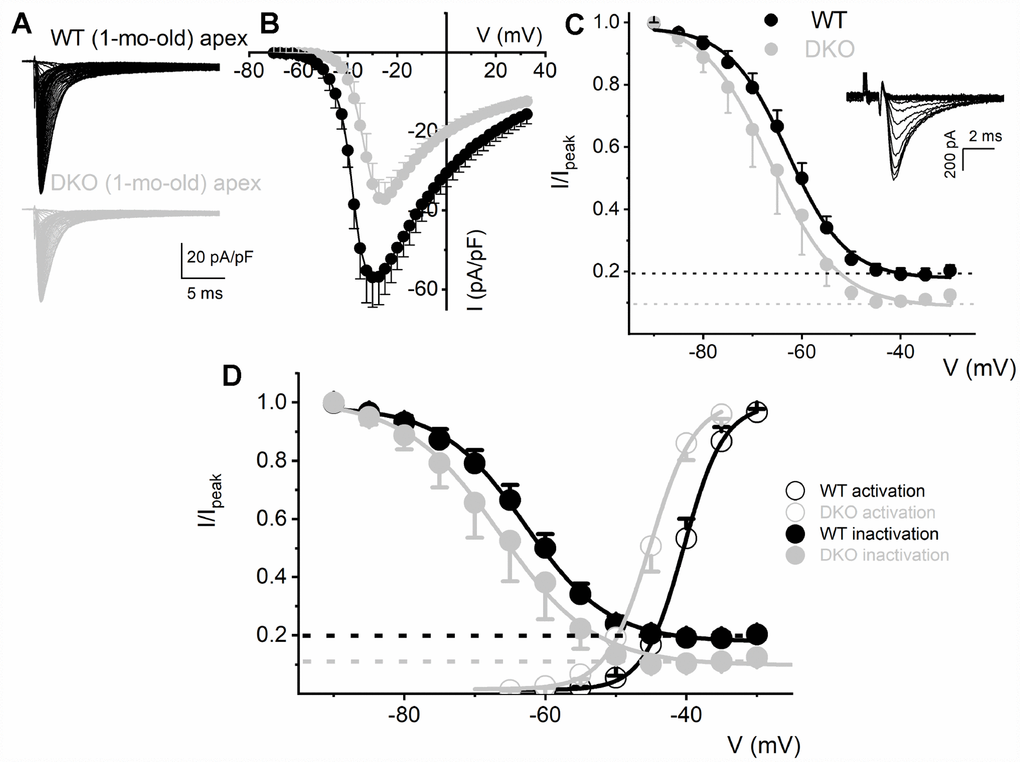
Figure 6.Reduced Na+ current density and available current in KNa1 DKO SGNs. (A) Whole-cell inward Na+ currents were elicited using depolarizing steps from -70 mV to 35 mV (ΔV = 2.5 mV). The currents were normalized to individual membrane capacitance (Cm), were recorded from 1-mo-old mice using apical SGNs from WT (shown with black traces) and DKO (shown with grey traces). Data were generated from 19 SGNs from each experimental group. (B) We observed consistent differences in peak Na+ current (I)- voltage (V) relation among WT (●) apical and DKO (●) SGNs. (C) Voltage-dependent inactivation was tested at -10 mV, using pre-pulse voltages ranging from -90 mV to 60 mV (ΔV = 5 mV) (see representative traces, inset). The mean normalized peak recovered-current versus voltage relation for WT (black line and symbol) and DKO (grey line and symbol) SGN from apical third of the cochlea are plotted (n = 9). The half-inactivation potentials (V1/2) were measured by fitting plots to the Boltzmann function. The V1/2 for WT was -62.9 ± 2.5 mV and the slope factor k, was, 6.2 ± 0.7 mV (n = 11) and DKO was -66.3 ± 2.7 mV and the slope factor k, was 6.9 ± 0.3 mV (n = 13). (D, E) WT (D) and DKO (E) activation and inactivation curves to illustrate window current and sustained/persistent Na+ currents available for activation of KNa1 current. The activation curves for Na+ currents from WT and DKO were fitted with the Boltzmann function. The V1/2 for activation WT SGN was -40.4 ±3.6 mV, and the slope factor k, was 2.9 ± 0.5 mV (n = 9) and DKO was -45.1 ± 4.8 mV, and the slope factor k, was 3.08 ± 0.8 mV (n = 11).