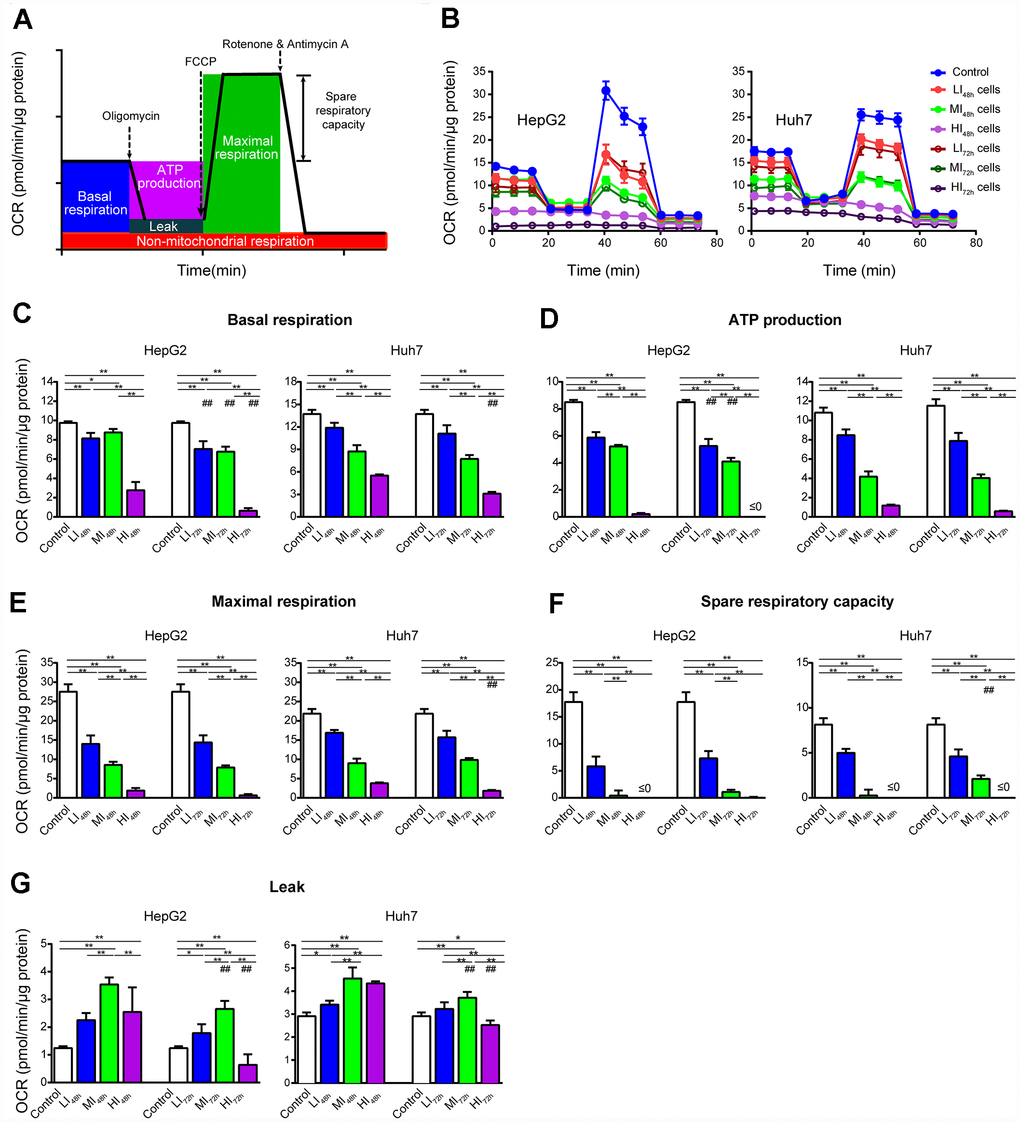
Figure 3.Changes in OCR of LI, MI and HI hepatocellular carcinoma cells. (A) Schematic of OCR analysis. (B) Representative OCR tracings of the control, LI, MI and HI cells at 48 h and 72 h. (C–G) The results of mitochondrial respiratory parameters for the control, LI, MI and HI cells at 48 h and 72 h. The results represent the mean ± SD, n=6 (except for HI48h HepG2 cells with n=5); #p < 0.05 and ##p < 0.01 compared to corresponding group at 48 h, *p < 0.05, **p < 0.01, and all statistical assessments were performed using one-way ANOVA followed by Dunnett′s test.